Macro Check, Systematic Decomposition of 2025 Macro Uncertainty

For the direction of US equities, the 10Y Treasury yield is one core gauge that succinctly shows the market's risk perception and the state of the US economy.
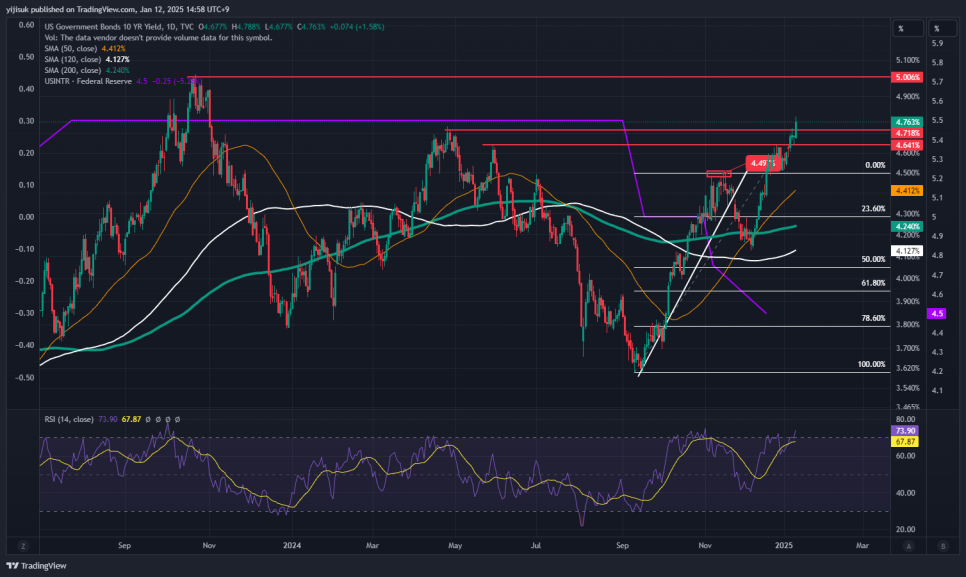
US policy rate vs 10Y Treasury yield — directions diverge from September 2024
Despite the Fed's repeated cuts, the 10Y yield keeps trending up. It shows the market is reducing long-bond demand amid monetary / fiscal-policy uncertainty — i.e. a Bond Vigilantes phenomenon. 2025 is a year of higher macro uncertainty than ever; this is a systematic decomposition and analysis of it.
1. Weak Long-Bond Demand
This year, the common root of the uncertainty is weak long-bond demand.
(1) The Treasury's funding source — a shift from bills to coupons
As stressed in (3) Taking the Liquidity Temperature: Scenarios, Yellen issued bills well beyond the TBAC-recommended level to expand liquidity and prop equities before the election. In the (2024) US Treasury yield-path note I conveyed that "to fund 2025 the weight must shift to coupon issuance." Market participants read the long-end-supply-increase signal. (The level of the long-bond-demand problem can be inferred from UST auction results — covered in detail later.)
(2) 1-B. The Trump administration's uncertain budget-financing plan
Trump's Agenda 47 targets deficit reduction via corporate tax cuts and government efficiency, but these conflict in practice.
- Corporate tax cuts and deficit expansion: a plan to make the 2017 individual income-tax cuts (set to expire 2025) permanent. The CBO estimates extending them adds $3.5T to the deficit through 2033.
- Universal tariff and inflation risk: a pledged 10–20% Universal Baseline Tariff on all imports — raising import prices, stoking inflation, directly affecting consumer prices.
- Higher government debt and issuance: tax-cut-driven revenue loss + tariff-driven inflation pressure increase the fiscal burden, raising the odds of more issuance to fund the deficit.
This ties directly to point 1 and is another factor raising the odds of higher long-end supply. The policies' efficacy / side effects are not yet closely assessed, but the market hates uncertainty.
(3) Sticky Inflation
CPI and PCE show US inflation is hard to tame. Despite the Fed's repeated cuts:
- CPI up two months running since September.
- Headline PCE up three months running.
- Core PCE also steadily up since June.
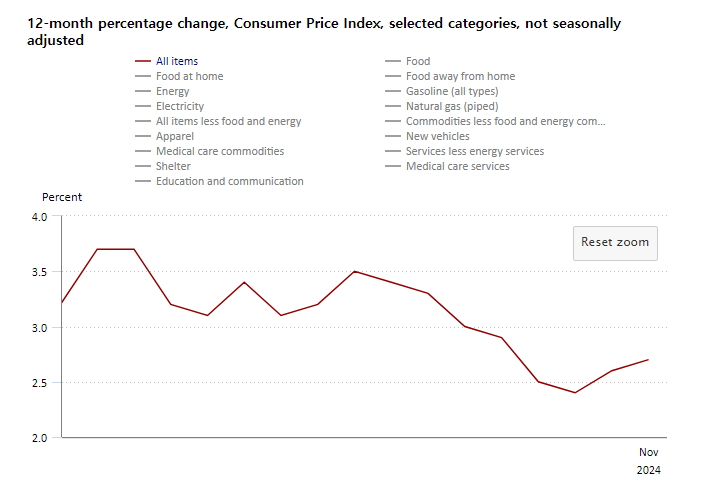
2024 CPI YoY
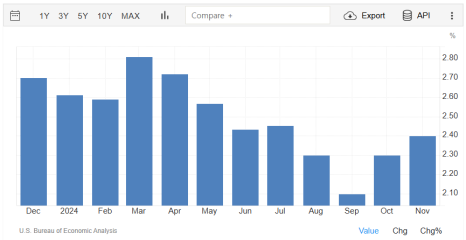
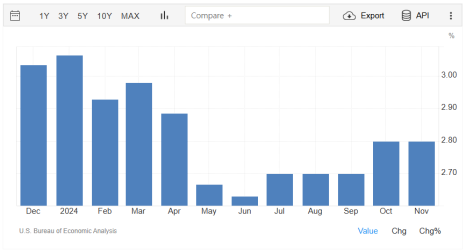
(top) 2024 headline PCE YoY, (below) Core PCE YoY
Why? US economic data explains it. From September to November, consumption growth was strong but production recovered slowly, and the manufacturers responsible for it remain cautious on economic activity (orders / consumption, production, employment).
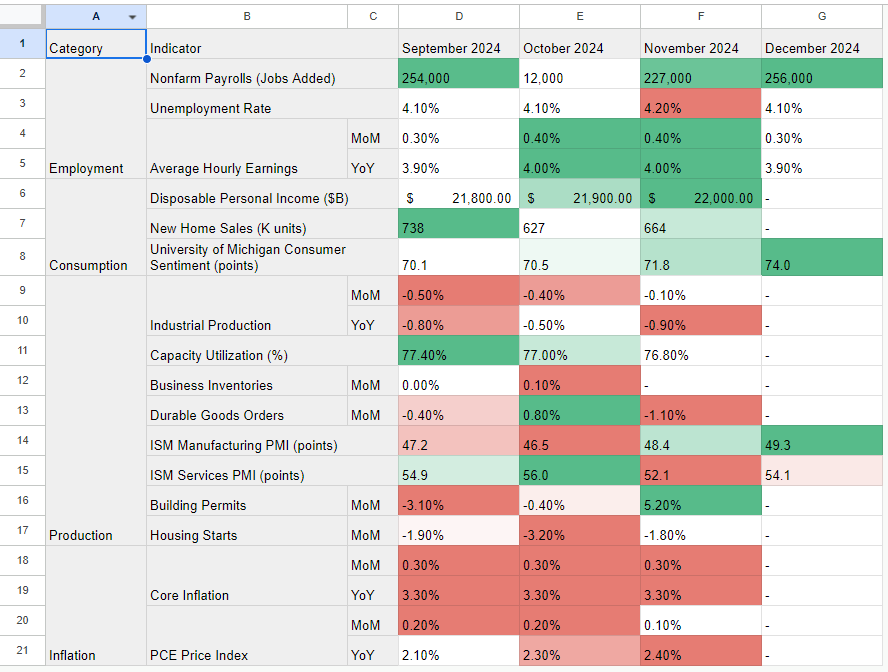
2024 Sep–Nov key-indicator trends
The consumption 〉 production imbalance naturally induced inflation. As the economy recovered and inflation-reignition signs appeared, the perception spread that the Fed must be more careful with the policy rate, raising uncertainty. In sum, inflation-reignition concern plus the long-end-supply-increase signal together are reducing the market's long-bond demand.
2. The Source of Market Volatility — Dealer Capacity Shortage
The Treasury issues debt; end investors (institutions / individuals) trade their cash for it; and dealers intermediate. A key dealer role is underwriting — making the auction succeed so the issuer raises needed funds, and guaranteeing it. If end investors are insufficient and bonds are oversupplied, dealers absorb the volume and provide liquidity — essential to the market's stability and efficiency.
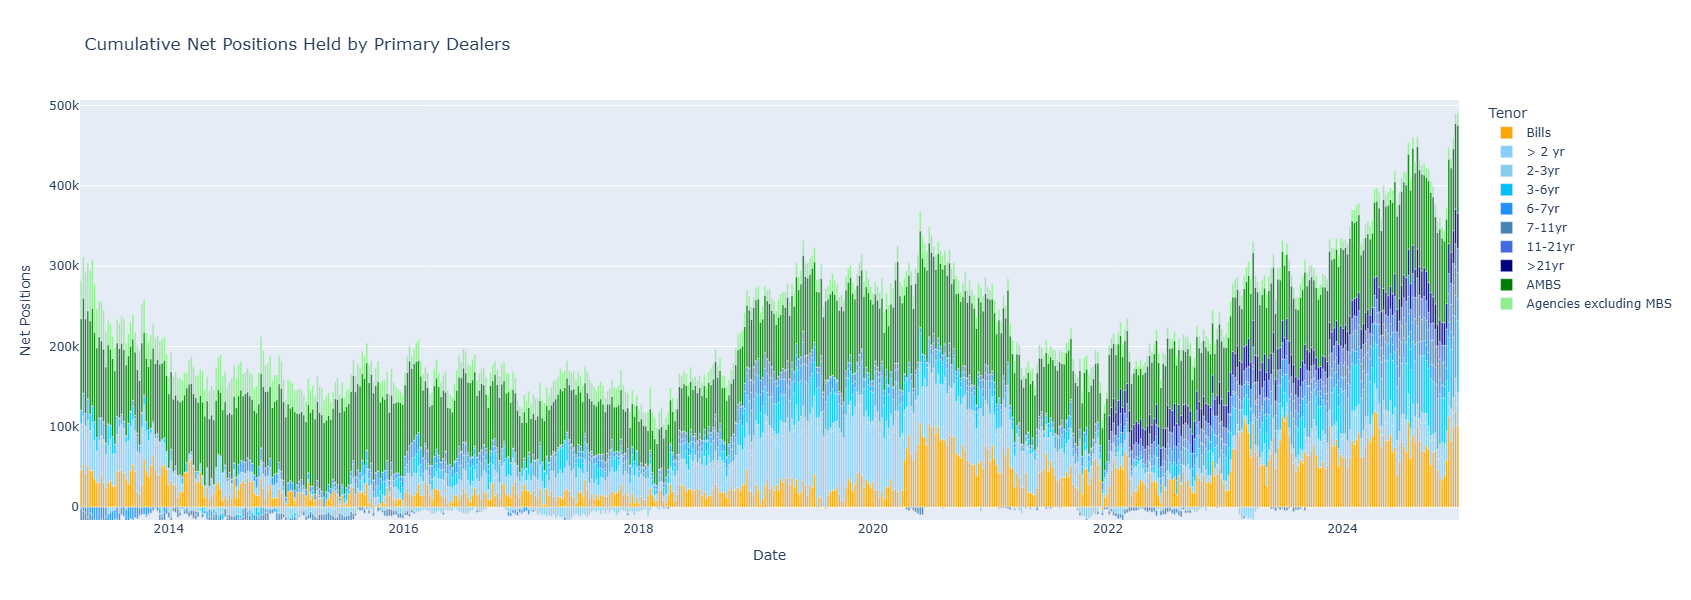
Bond-dealer position distribution and change
Dealers currently carry ~$500B of Treasuries. In this state, reduced additional-underwriting capacity is the "dealer capacity shortage." Since dealers are the main supplier of repo-market liquidity:
liquidity capacity ↓ → market liquidity ↓ → participation risk ↑
→ bond yields ↑ (to compensate) → repo funding cost ↑
→ leveraged-position cost ↑ (long & short) → equities affected, liquidity ↓ + volatility ↑
So the convergence of higher long-end issuance and weaker long-end demand likely causes a dealer-capacity shortage. Essentially, the current market risk stems from the possibility of repo-market stress from dealer-capacity shortage.
3. Other Watch Points
(1) System-liquidity check
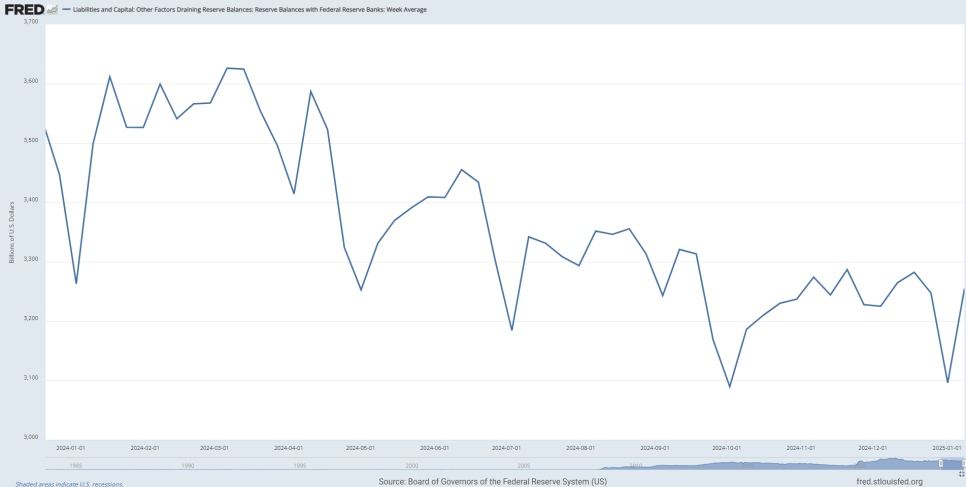
Reserve Balances with Federal Reserve Banks: Week Average
Per (1) Taking the Liquidity Temperature: Fundamentals, the change in reserves explains system liquidity:
ΔReserves = ΔSOMA + ΔLending facilities − ΔTreasury TGA − ΔRRP
Over the year since early 2024, reserves trended down. By constituent account:
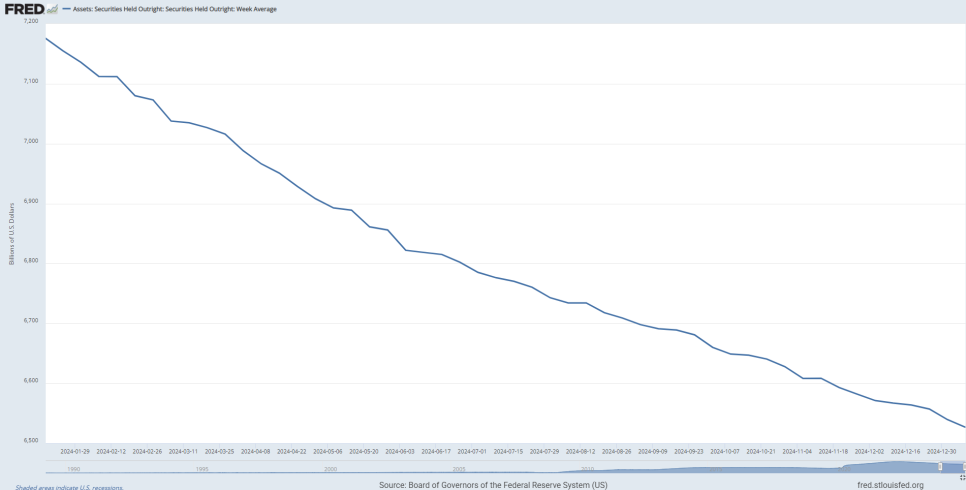
Securities Held Outright (SOMA) — under QT, holdings and balance decline
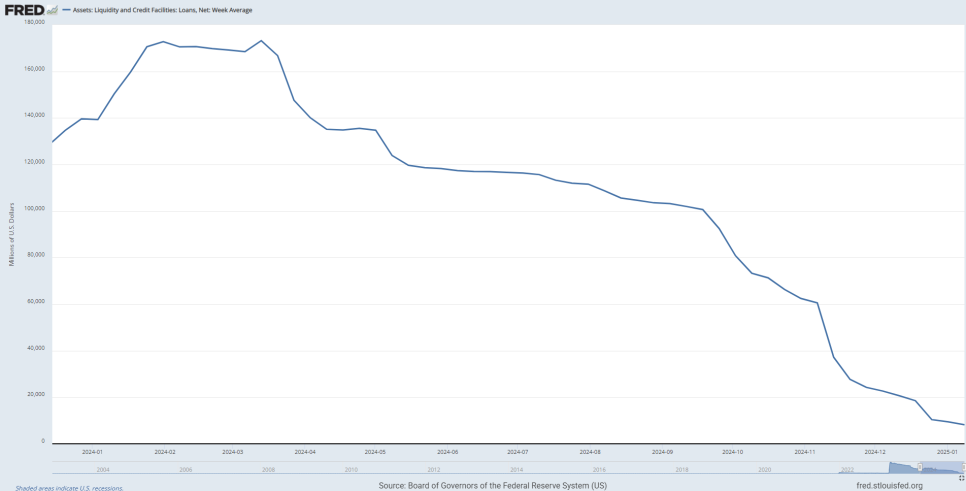
Liquidity and Credit Facilities: Loans
The channel for supplying liquidity to banks via loans during stress. In the 2023 SVB / regional-bank run, lending against Treasuries and supplying liquidity via BTFP etc. The BTFP early-repayment scenario anticipated in (3) Taking the Liquidity Temperature: Scenarios — the September cut pushed market rates below banks' BTFP draw rates, and as BTFP has no early-repayment penalty, banks repaid early and re-borrowed lower (the lower market rates went, the faster early repayment).
from
to
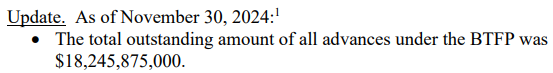
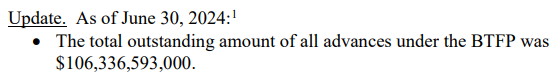
After the first cut, from October the lending-account balance decline accelerated; per the monthly BTFP report it fell markedly from $106B (Jul '24) to ~$18B (Nov '24).
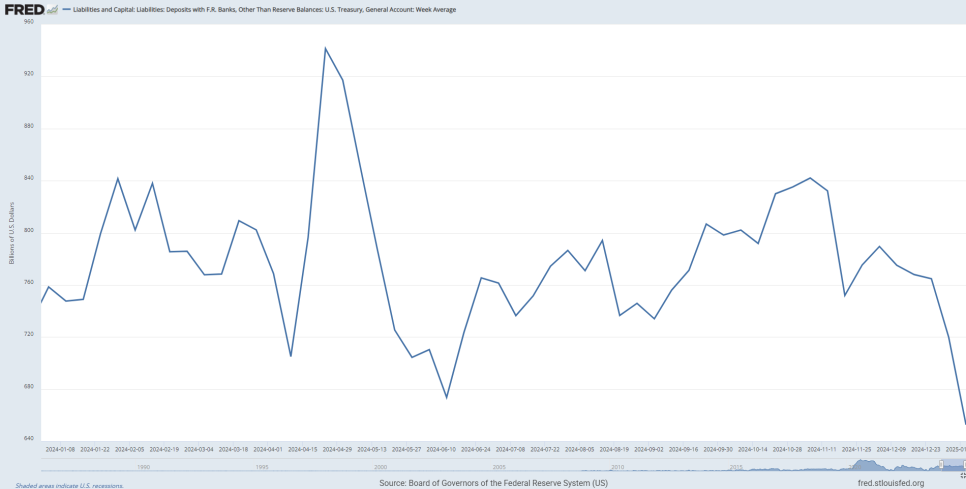
US TGA Balance: Week Average
At end-2024, having hit the debt ceiling, the Treasury drained the TGA to reduce debt for negotiating leverage in the January 2025 debt-ceiling talks.
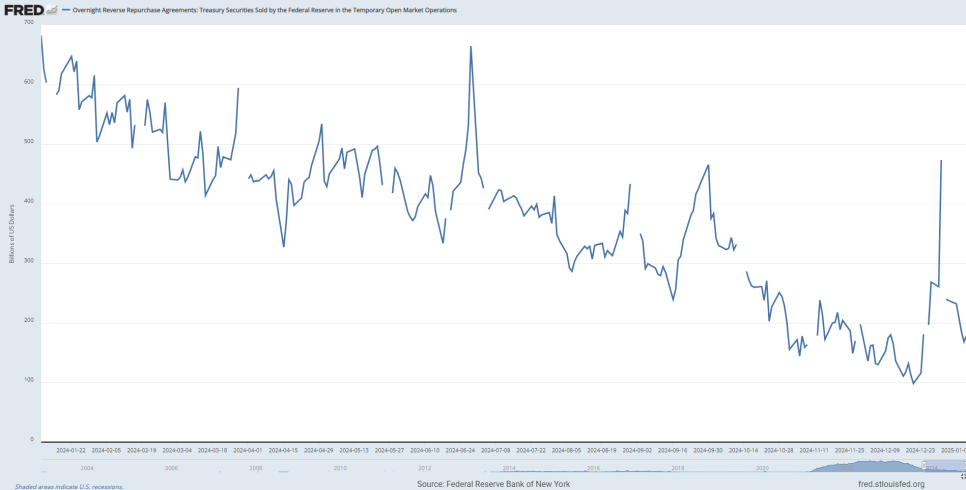
Overnight Reverse Repurchase Agreements (RRP)
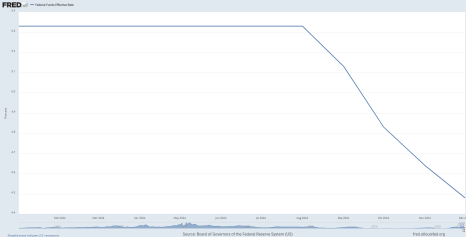
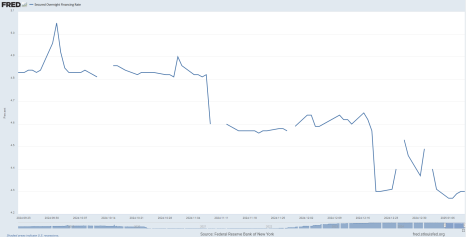
(left) Federal Funds Effective Rate, (right) SOFR (repo rate)
With the cut, the RRP rate at the band's floor also fell. RRP funds kept shrinking through end-2024 because SOFR (repo) ran well above the RRP rate, so MMFs moved funds into repo for higher yield. For rate levels, see (1) Taking the Liquidity Temperature: Fundamentals.
In sum:
ΔReserves ↓ = ΔSOMA ↓↓ + ΔLending facilities ↓↓ − ΔTreasury TGA ↓↓ − ΔRRP ↓
Reserves are on a slow, sustained downtrend. So how is total financial-market liquidity? Reference bank-reserve change rate and Reserve Demand Elasticity (RDE) — which explains the change rate of bank reserves to changes in Fed reserves. When RDE stays flat and near zero, bank reserves are not much affected by Fed-reserve changes (a sound liquidity environment).
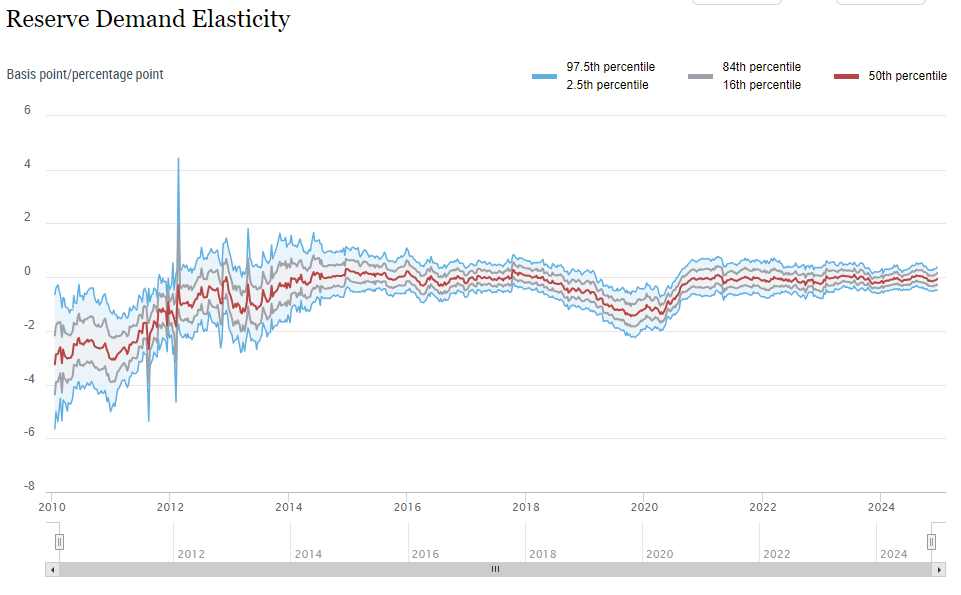
The current RDE shows no major problem in banks' liquidity environment. Even with Fed reserves slowly declining, it is not a severe situation that would immediately hit system liquidity negatively.
(2) Corporate interest-cost problem from rising long-end yields
2025 is also a year to watch US corporate interest cost. In the 2020–21 COVID ultra-low-rate environment, companies borrowed heavily in long-dated, fixed-rate debt; fixed-rate loans (typically 3–5 years) start maturing this year. Capital-intensive industries like infrastructure and manufacturing enter a full repayment period from 2025. Specifically, fixed-rate corporate loans equal to ~9% of US GDP are due to be repaid through 2027 — $700B in 2025, $1T in 2026.
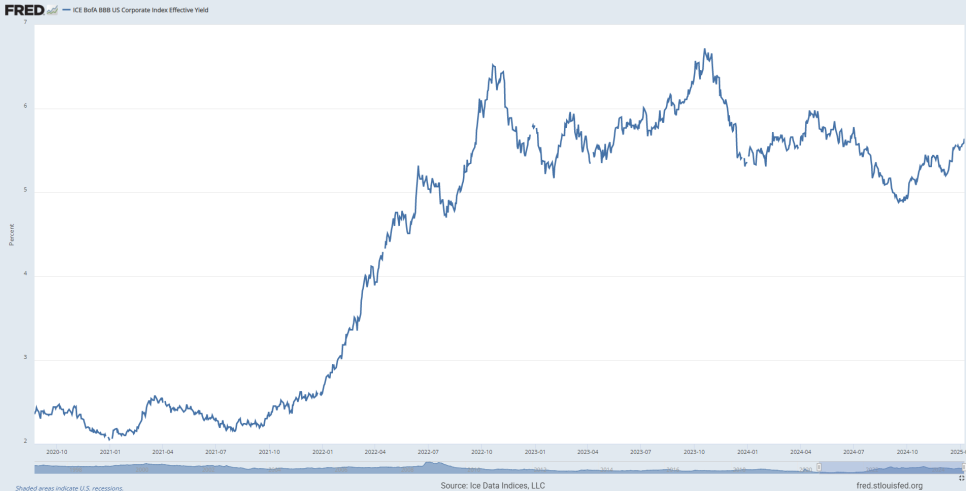
ICE BofA BBB US Corporate Index Effective Yield
Non-financial BBB-rated corporates (ICE BofA BBB US Corporates), where domestic infrastructure / manufacturing firms concentrate, funded at ~3.8% in 2020–21. Amid the tightening cycle, repaying existing debt would likely apply a rate near 6% (given the current trend). As noted in the data section, infrastructure / manufacturing already show slow production recovery and caution, so higher interest cost is a burden — adverse for capital-dependent firms, potentially slowing the recovery. In conclusion, US consumption is still strong, but high interest cost raises the odds of management difficulty for heavily indebted firms, delaying production-growth recovery and adding to economy-wide uncertainty — a key risk.
4. Summary
Risks to watch now:
- Unavoidable long-end supply increase from 2025 US government financing.
- A dealer-capacity-shortage event from the bond-vigilante phenomenon plus potential bond oversupply.
- Falling system liquidity in H1 2025 — though, given the flat RDE, expected to act as a risk only within the equity-market scope.
- Possible recovery delay from rising interest cost for infrastructure / manufacturing firms in 2025.