On the Bessent-Warsh Regime Pt. 2 | Oil-Lag Residual and the Market's Forward Repricing

- In Part 1, we established that the single point of failure for the Bessent–Warsh regime is the inflation path.
- The most powerful variable that could put pressure on that path is the lagged passthrough of the February 28, 2026 oil shock.
- Part 2 unpacks the four channels through which the oil shock transmits into inflation, examines the possibility that the historical sensitivity of the most dangerous channel — channel 4 — has weakened, and cross-checks how the market is pricing the disruption against PPI and the Dubai futures spread.
3. Oil-Lag Residual ⎯ Transmission Channels and the Market's Forward Repricing
(1) The February 28, 2026 oil shock, revisited
- 2026-02-28: US–Israel strikes on Iranian nuclear-adjacent facilities → crude and shipping shock.
- Spot prices spiked, then partially retraced — but the lagged passthrough is still unfolding across Q2–Q3 2026.
- It's the most powerful variable that could put pressure on the Bessent–Warsh regime's inflation prerequisite. Whether inflation expectations actually move in line with their historical sensitivity, however, is a separate open question.
1) Spot prices and shipping data
| Metric | Pre-shock baseline | Post-28 Feb high | Early May high (UAE strike / negotiations) | Post-May 8, 2026 settlement high |
|---|---|---|---|---|
| WTI | ~$55–65/bbl | ~$112.5/bbl | ~$107.2/bbl | ~$99.2/bbl |
| Brent | ~$60–70/bbl | ~$113.7/bbl | ~$113.7/bbl | ~$106/bbl |
| Dubai | ~$58–70/bbl | ~$120.03/bbl | ~$105/bbl | ~$101.2/bbl |
- On a headline basis Brent retraced to the low-$90s, but Iran's May 5 strike on the UAE re-spiked it to a fresh $114 high.
- The Strait of Hormuz has been in partial closure for roughly 10 weeks since late February. The market is pricing spot but underpricing the lagged passthrough.
(2) Persistence of the Hormuz disruption
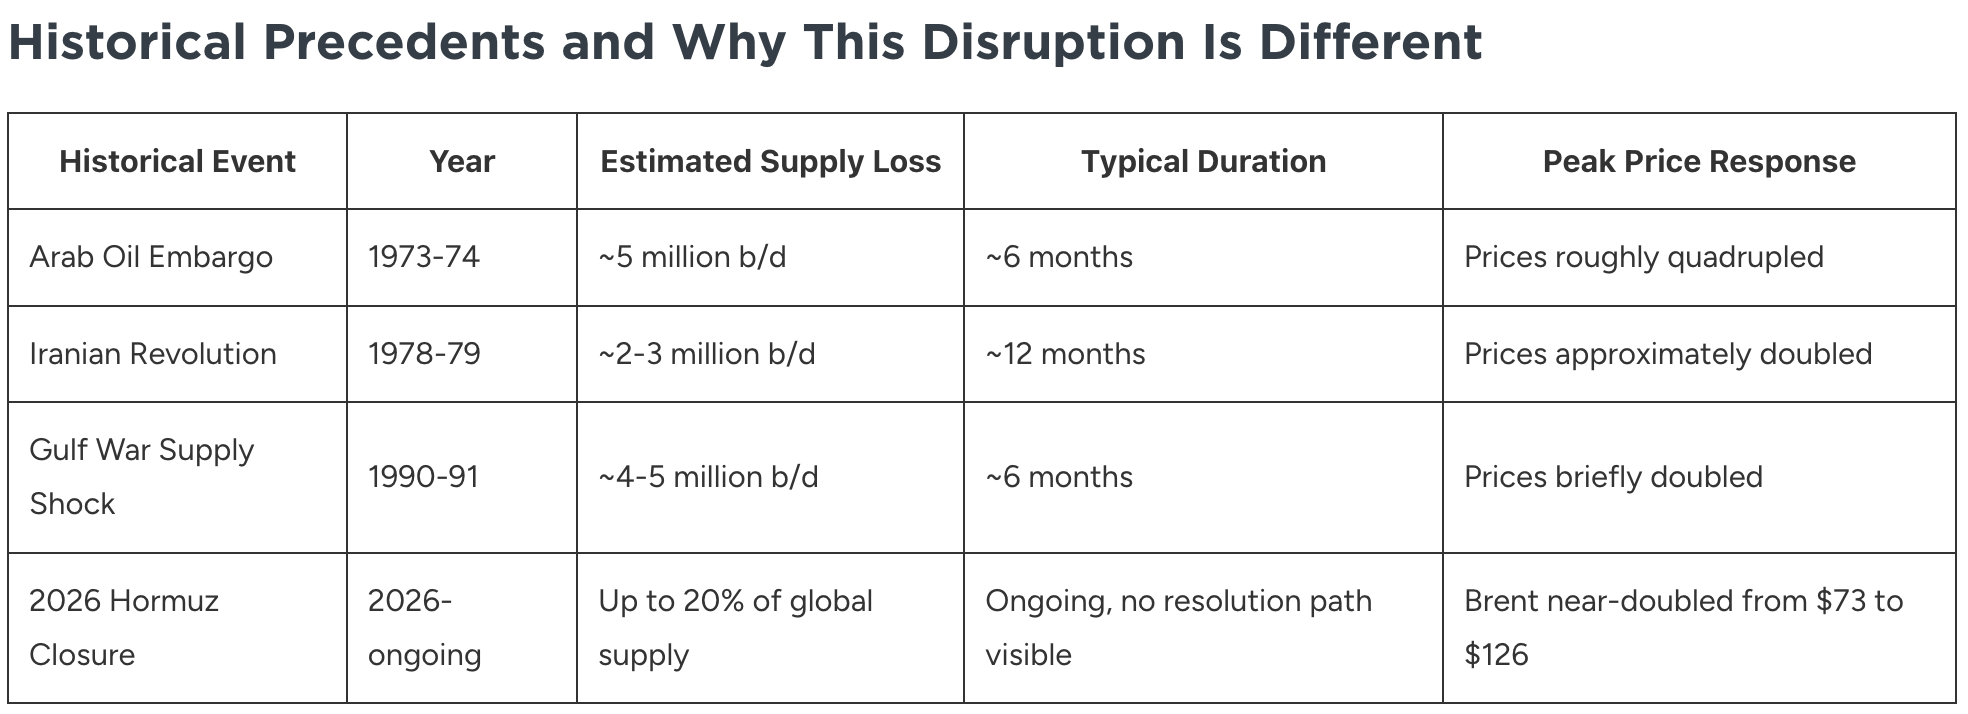
On an objective read, this Hormuz closure delivers a larger crude-supply shock than any prior Iran-related conflict.
- The IRGC has been collecting tolls of roughly $1 per barrel for passage through the Strait since late March 2026 — accepting payment in Bitcoin, stablecoins, and the Chinese yuan.
- Trump has signaled openness to extending the negotiation window with Iran and to a possible deal before the US–China summit, which has pulled market attention substantially away from the US–Iran conflict.

- Per Bloomberg's May 11 (US time) reporting, the Strait of Hormuz remains, in practice, blockaded.
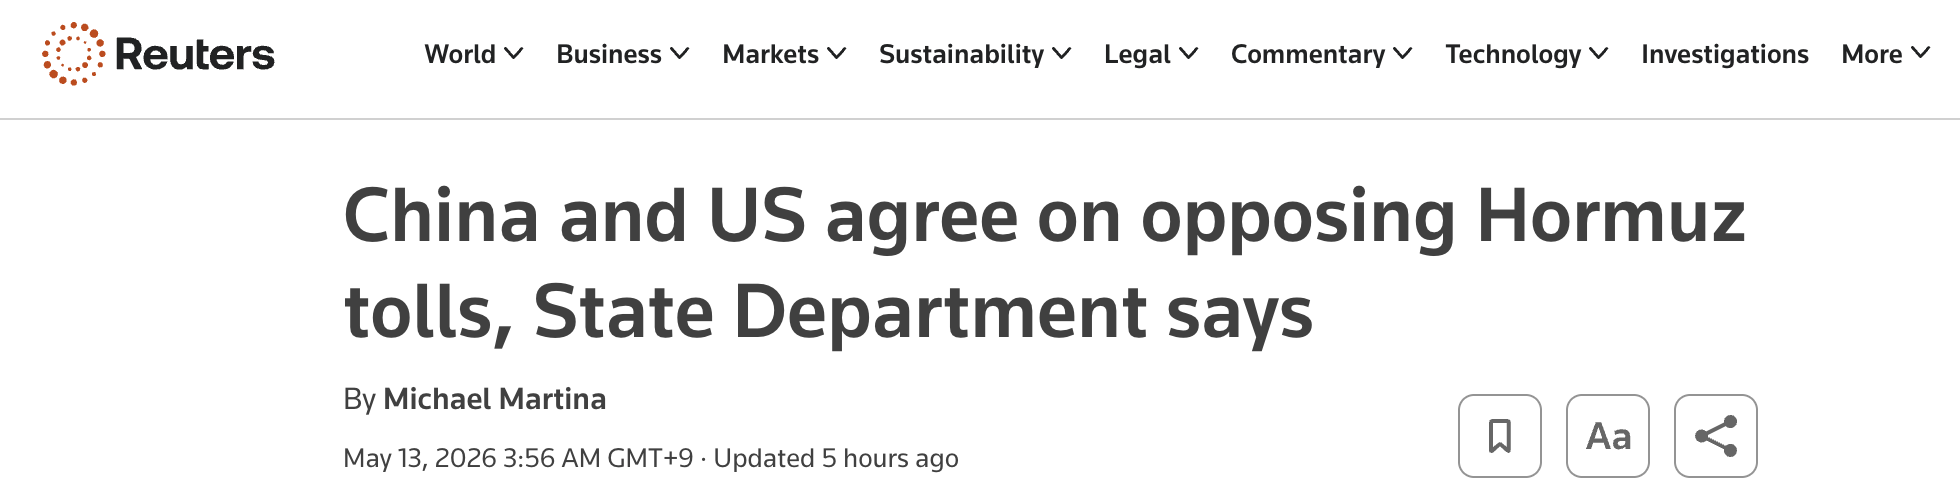
- May 12 (US time), per the State Department (Reuters): in their April phone call, Secretary of State Marco Rubio and Chinese Foreign Minister Wang Yi reportedly agreed on the principle that "no country or organization can be allowed to charge tolls to pass through international waterways like the Strait of Hormuz."
- The Trump–Xi summit in Beijing this week will include the Hormuz issue on the agenda — a new diplomatic channel through which the US is leveraging China's influence over Iran to push for an end to the disruption.
- That said, China vetoed the US-led UN resolution on Hormuz protection in April and has ordered its refineries not to comply with US sanctions — principle-level alignment does not automatically translate into follow-through.
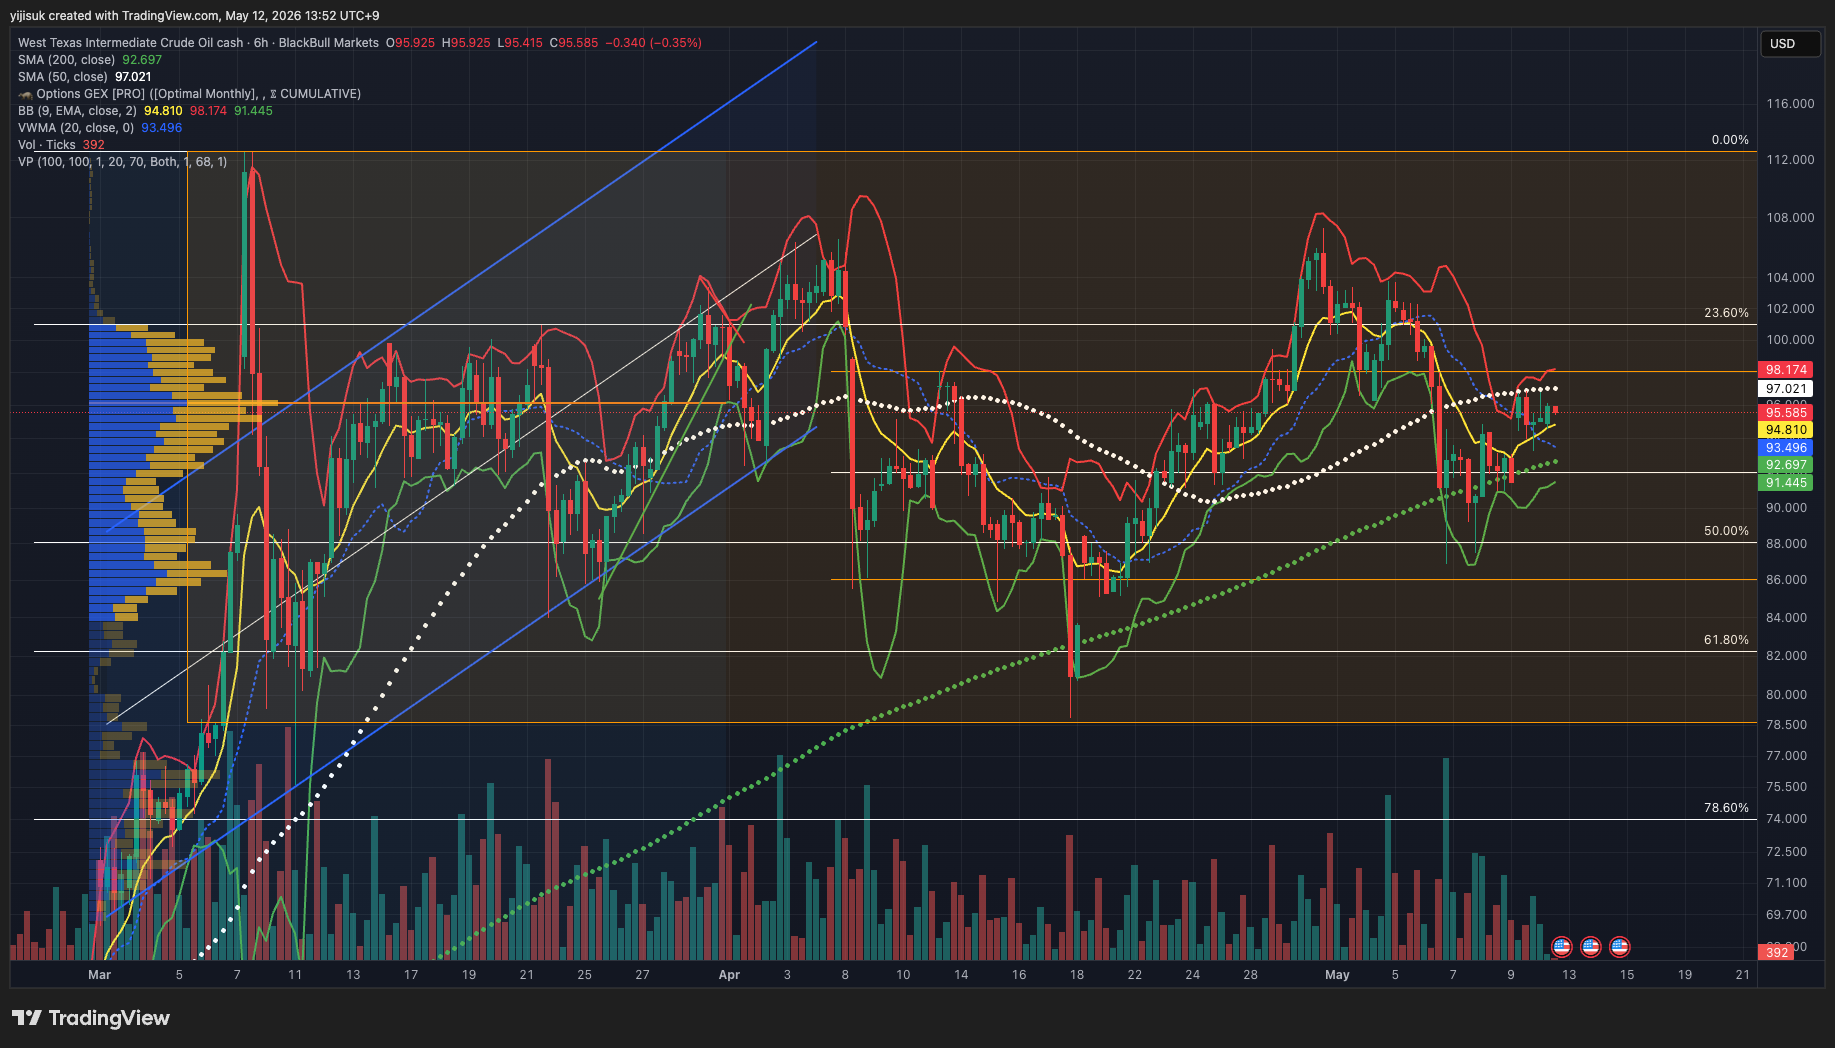
- WTI spot, 6-hour bars,
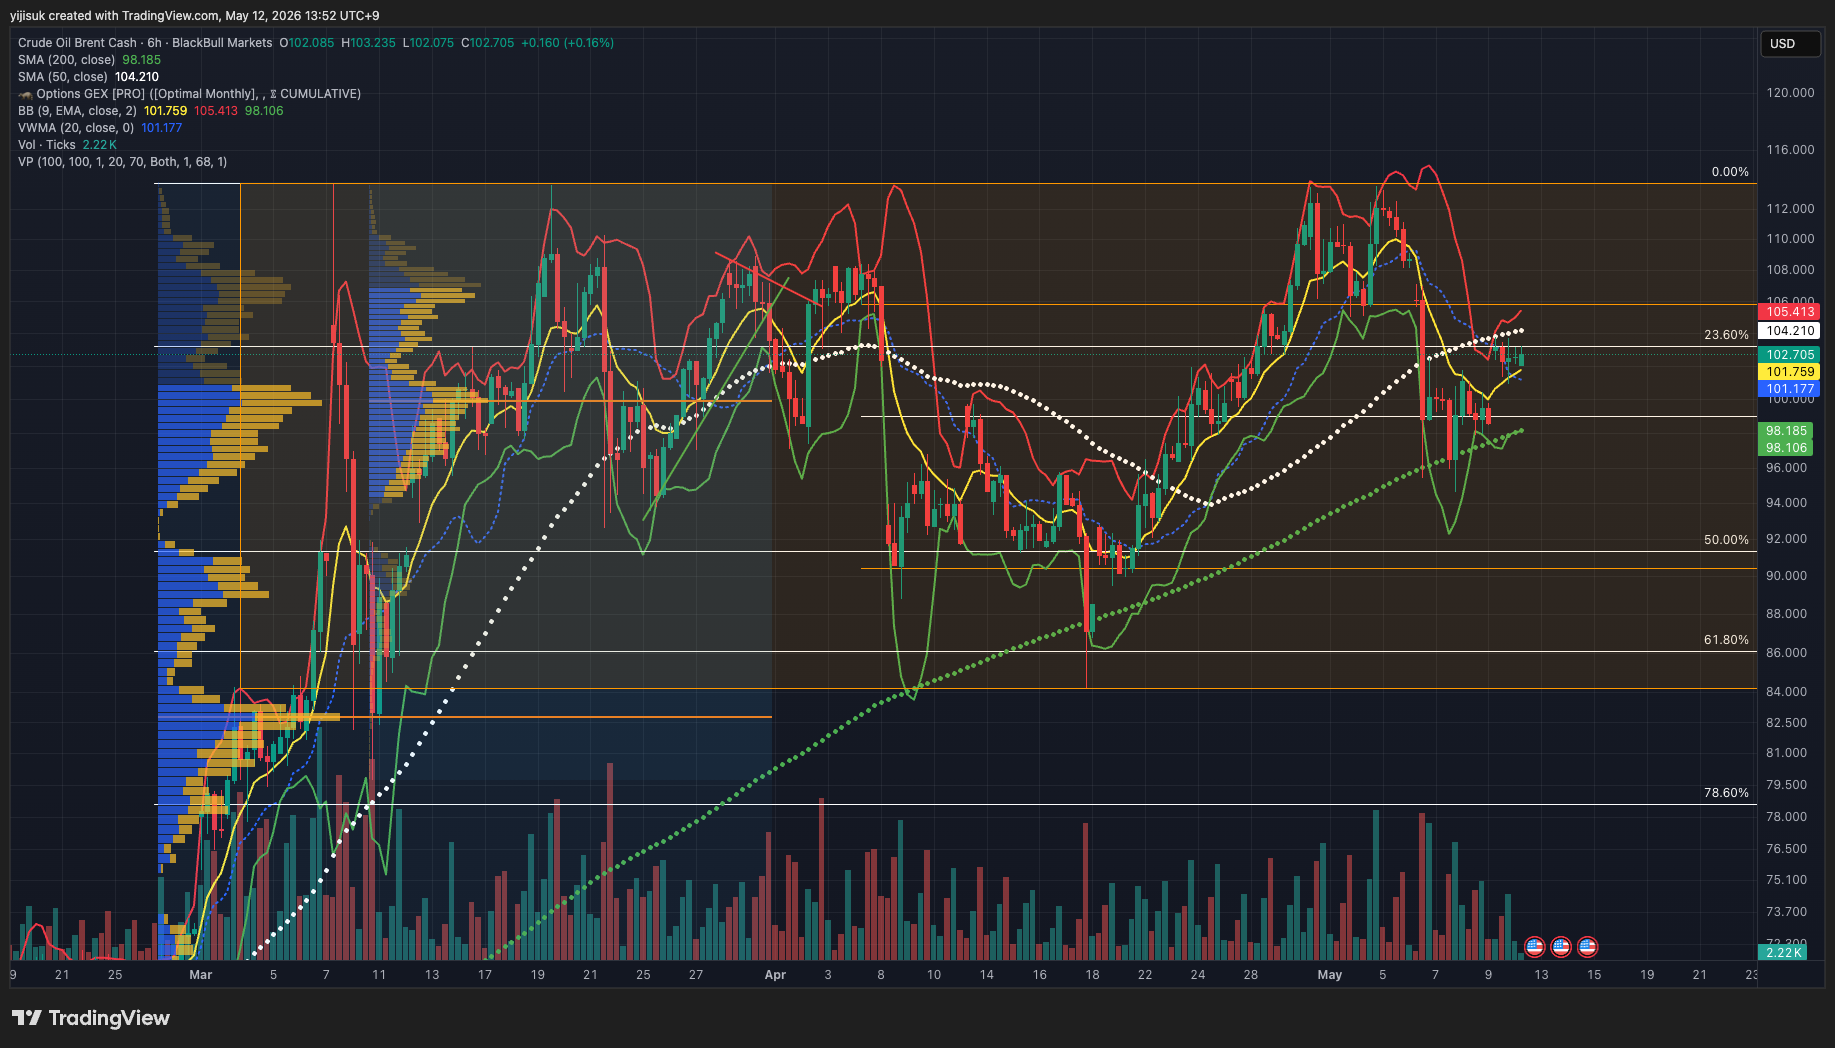
- and Brent spot on the same 6-hour basis — crude prices have broken out of their short-term downtrend, with upward pressure rebuilding.
(3) The four transmission channels
- Why we don't pin a quantitative lag to each channel: inventory levels, refining-margin structures, and shipping-contract maturities vary widely by producer and industry, and no publicly available single range is credible.
- Below we set out only the direction and relative ordering of the lags. Actual timing has to be read print by print from individual releases.
Channel 1 ⎯ Inventory and input-cost passthrough (relatively slow)
Crude → refining → petrochemical / plastic and other industrial inputs → core-goods CPI
- Refiners, petrochemical producers, and downstream manufacturers first work through inventory bought at pre-shock prices.
- After that inventory turns, the backfill comes at shock-period prices — and the cost increase shows up in core-goods CPI through plastic, petrochemical, and logistics input costs.
- Industry-specific turn rates make precise timing hard to forecast — but Q1 2026 earnings guidance from industry leaders converges on a multi-quarter horizon.
Pulling together Q1 2026 earnings call commentary from refining and chemical majors, channel 1's current stage can be read on three angles — (1) how many quarters the overall disruption is expected to run, (2) why the market won't immediately return to normal flow even once the Strait reopens, and (3) which industry-side indicators let you track progress in real time.
1. Industry leaders' duration guidance on oil-driven cost pressure ⎯ converging on multi-quarter
The tone from chemical and refining major CEOs is consistent — "not months, but multiple quarters" — signaling that channel 1 won't wrap up quickly.
- (LyondellBasell) CEO Peter Vanacker: "The impacts from the war will be long-lasting ... not to be measured in quarters. It's probably gonna be multiple quarters, definitely not months."
- (Dow Chemical) CEO Jim Fitterling: modeled a "275 days or longer" scenario early in the conflict, with the timeline since extended by additional asset shutdowns.
- (Dow Chemical) COO Karen Carter: "we expect that this environment is going to continue in alignment with the duration of the recovery that we believe is going to take 6 months anywhere to 18 months to resolve."
2. Strait reopen ≠ resolution ⎯ logistics backlog as the binding constraint
The market often shortcuts "Strait reopens = disruption resolved," but industry commentary makes clear that an additional lag (vessel repositioning, tanker backlog clearance, product transit) sits between the political reopening and physical normalization.
- (ExxonMobil) CEO Darren Woods: even after the Strait reopens, ships repositioning, backlog clearance, and product transit imply a 1–2 month lag before normal flow returns. Inventory replenishment demand then adds another demand layer on top.
- (Dow Chemical) Fitterling: "All of that tankage is full and sitting in the Arabian Gulf. We have to clear that. ... You're going to have to get a lot of empty vessels back in the Gulf before you can restart plants." Even after the Strait disruption ends, clearing the tanker backlog is the critical path.
3. Inventory benchmarks and observable indicators
The industry-side metrics that let you track where channel 1 stands in real time — the faster the inventory buffer drains, the deeper the channel runs into its high-pressure phase.
- Korean refiners (SK Innovation, S-Oil, GS Caltex, HD Hyundai Oilbank) typically hold ~3–4 months of crude inventory buffer. In Q1, the simultaneous drawdown of low-cost stock and elevated product prices delivered an inventory-valuation gain.
- (Dow Chemical) Days Sales in Inventory (DSI — inventory expressed in days of sales): 66 days (March 31, 2026) vs. 61 days (Q1 2025). A directly observable indicator of inventory build on the industry side.
- ExxonMobil commercial inventory is approaching "min working levels" (the minimum inventory needed to keep operations running). Woods: "once inventories reach those minimum working levels, that source of supply is effectively lost." That point marks the inflection from channel 1's mid- to late-transmission phase.
Channel 2 ⎯ Refined product pricing (the fastest channel)
Crude price → refining price → gasoline / diesel / jet fuel retail price → CPI energy
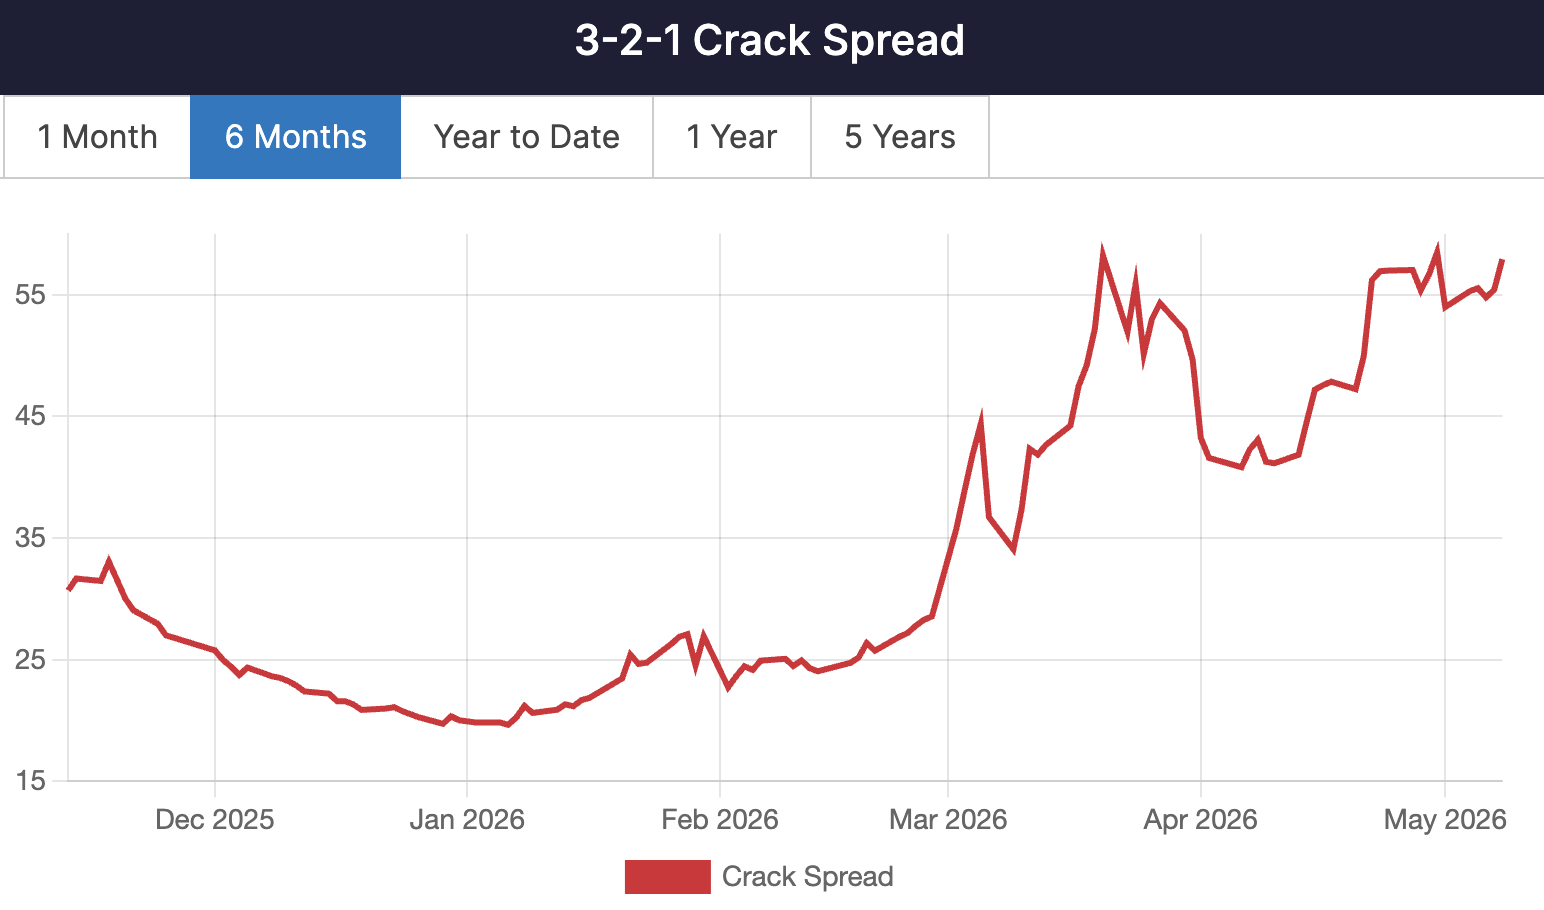
- The crack spread (refining margin) widened sharply during the shock window and — after partial retracement — has stayed materially elevated.
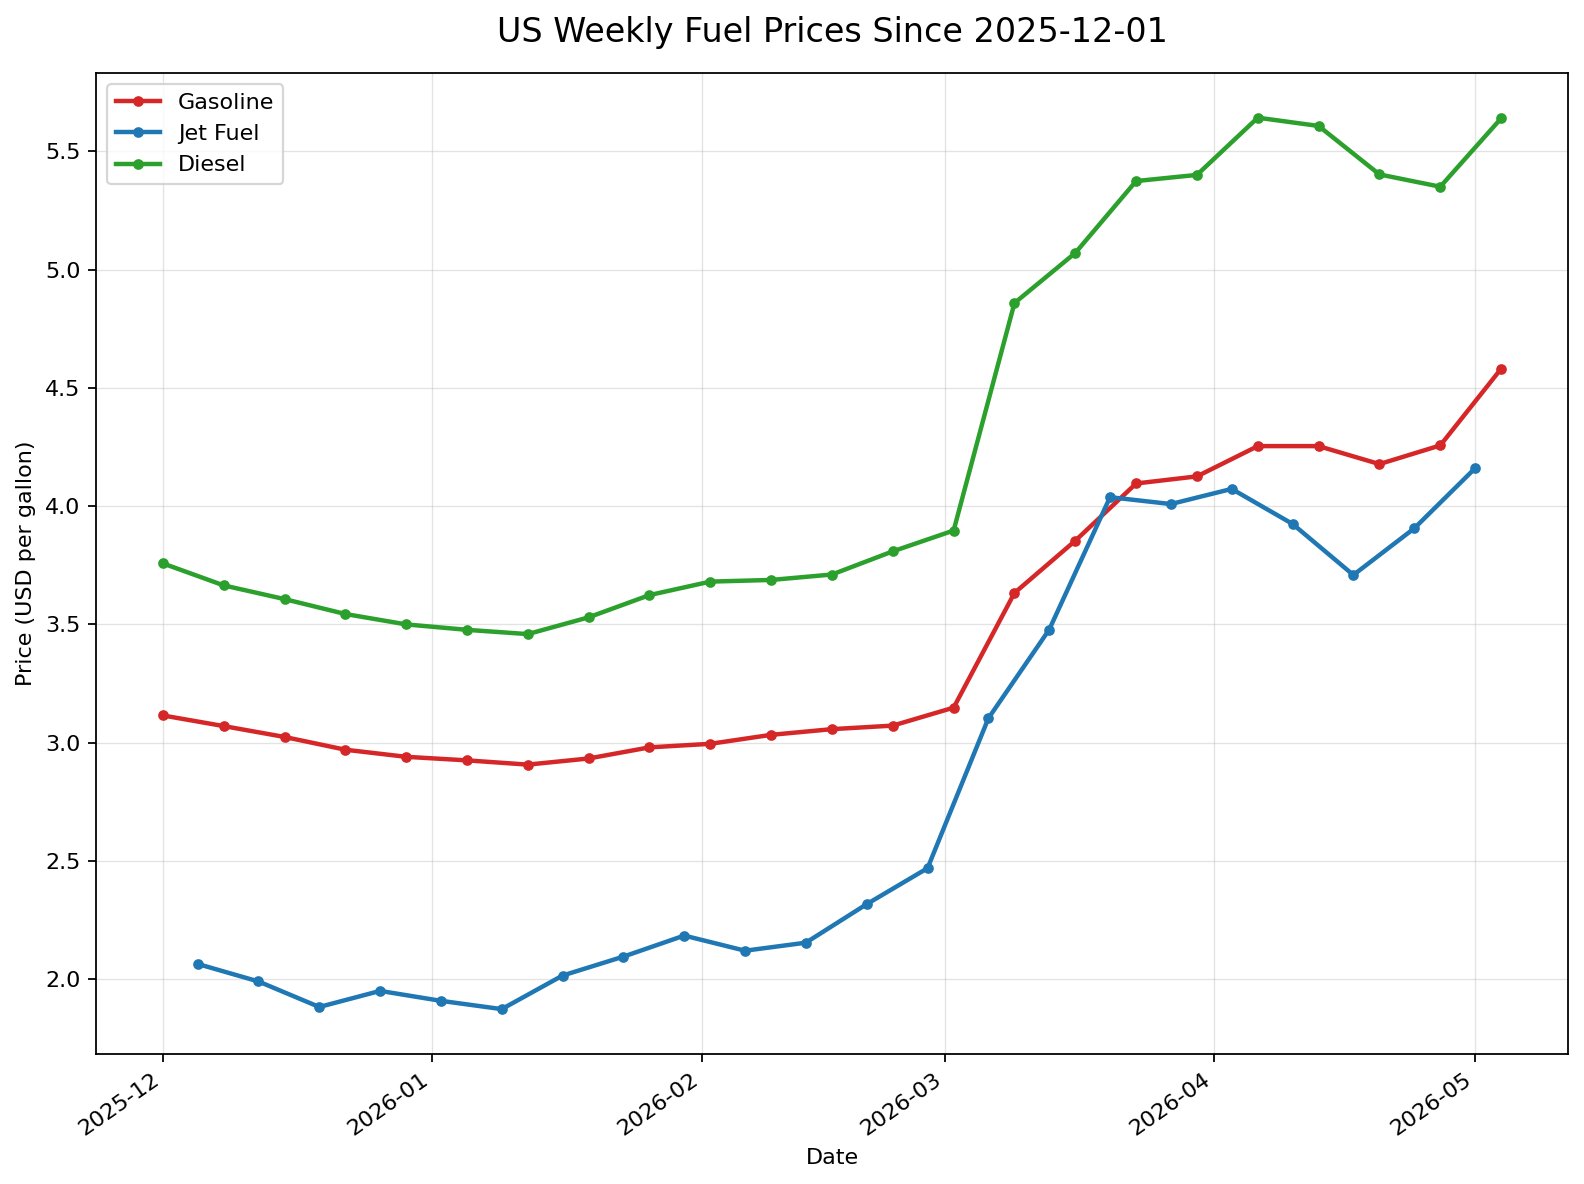
- Retail prices for gasoline, diesel, and jet fuel reflect spot with the shortest lag.
- Channel 2 is the fastest because (a) refiners price wholesale off the marginal next-barrel cost, not average inventory cost,
- (b) wholesale itself is tied to NYMEX RBOB futures and resets daily at settlement, and
- (c) the inventory buffer at the gas-station level (tanks holding 1–2 days of throughput) is too thin to absorb wholesale moves — they pass straight through to retail.
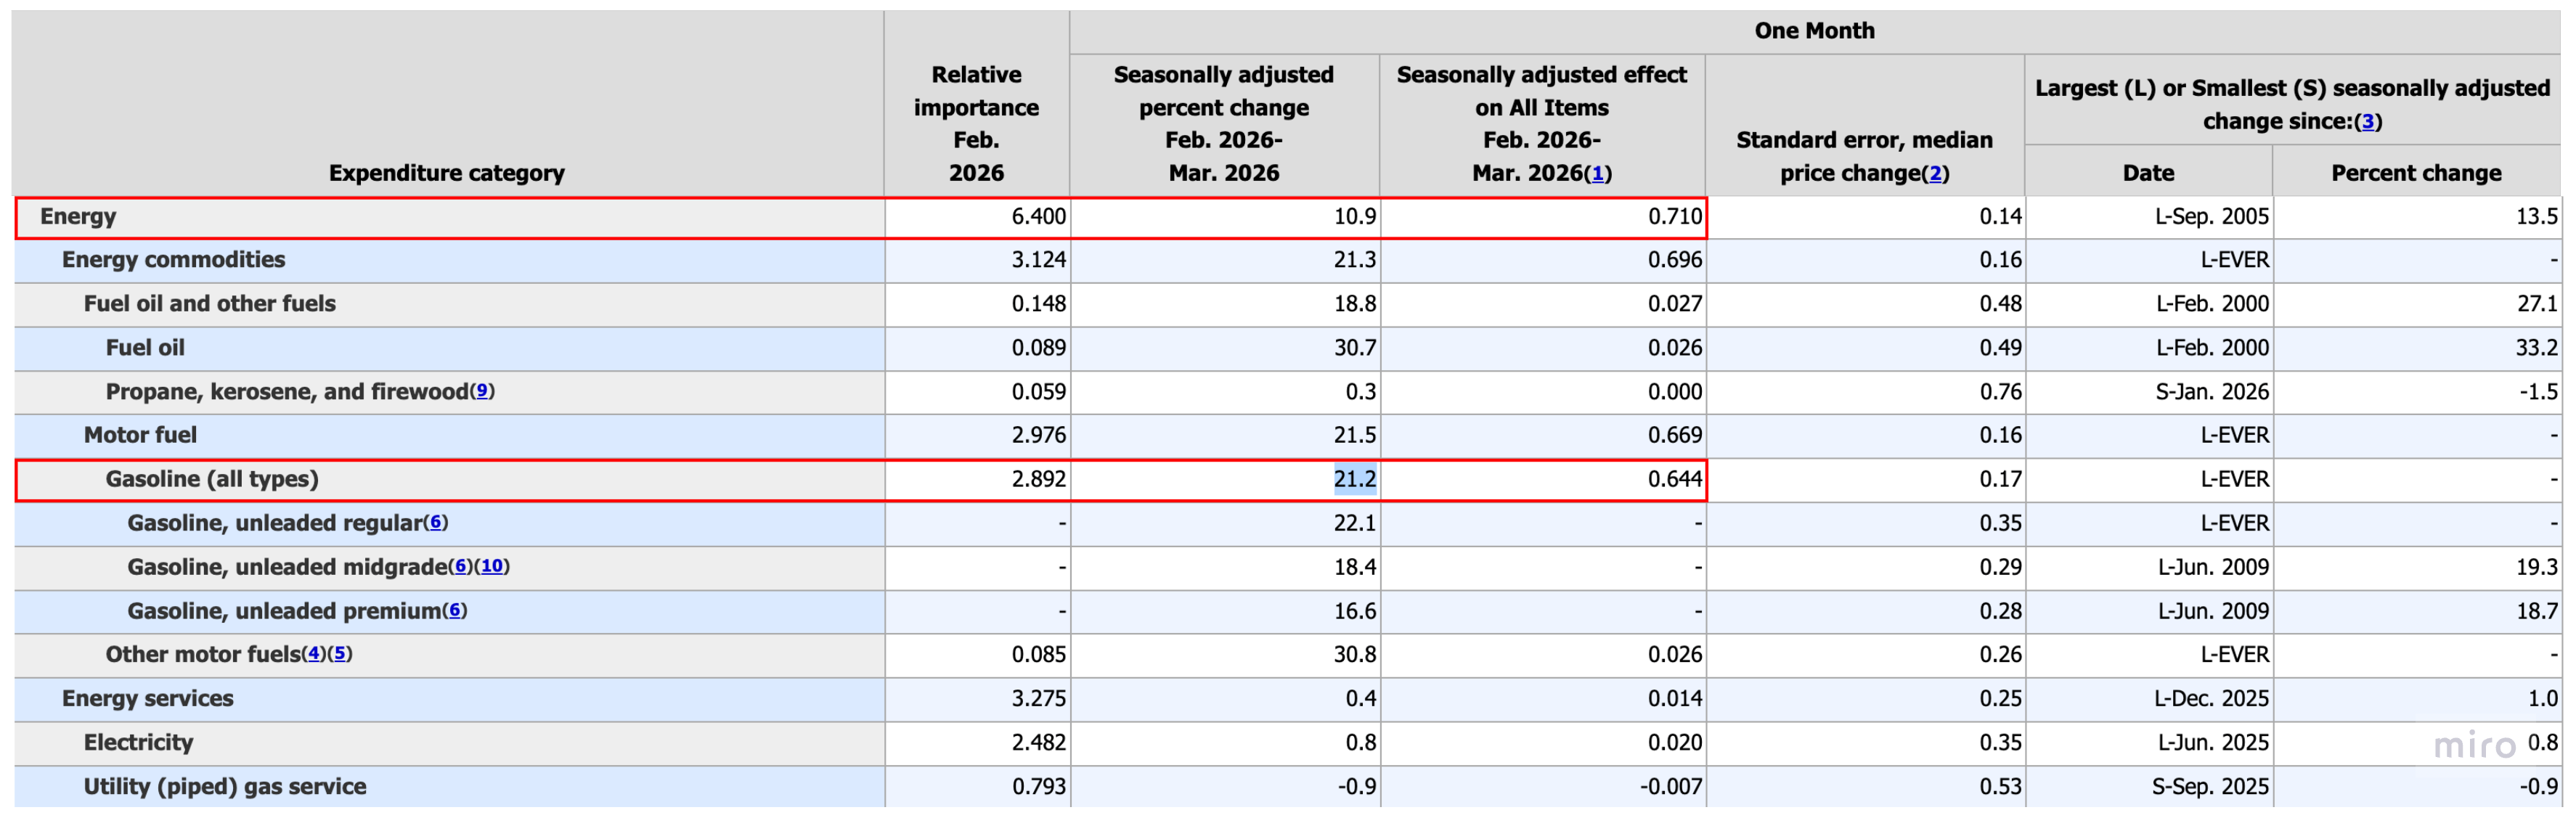
- BLS March 2026 CPI: gasoline +21.2% MoM, energy +10.9% MoM, contributing +0.71pp to all-items.
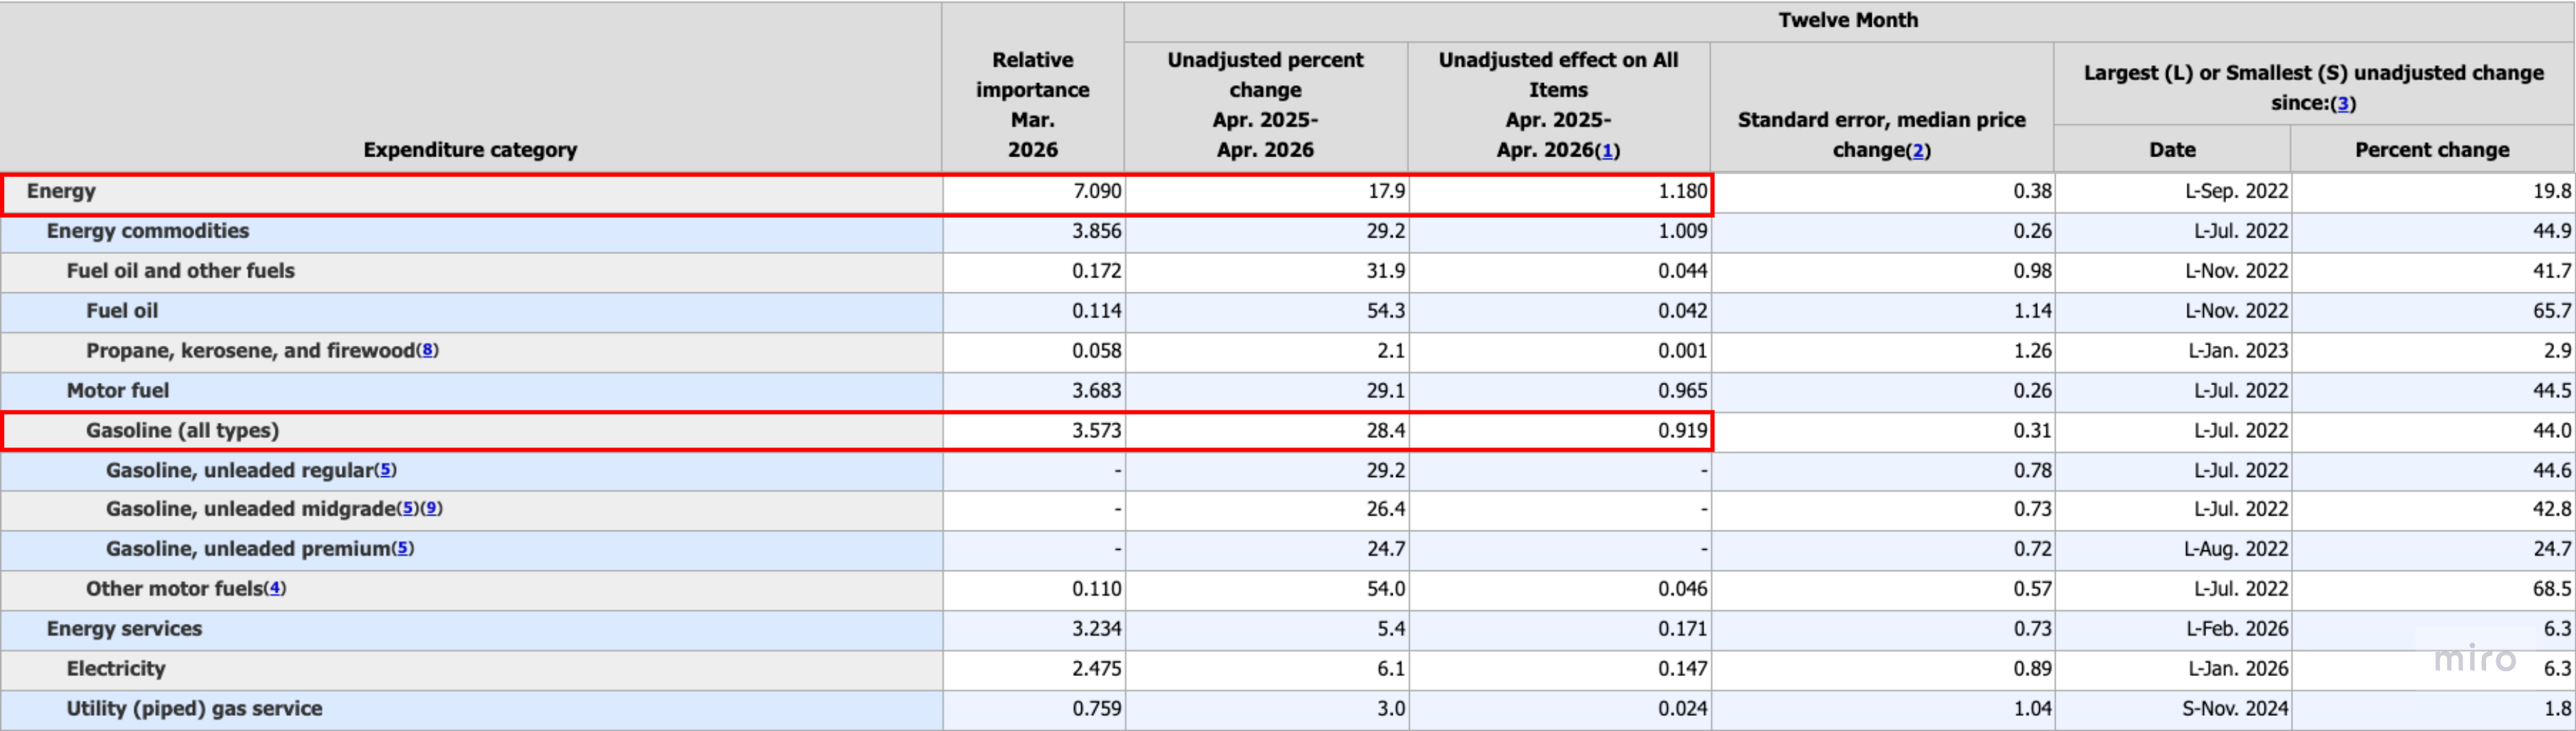
- BLS April 2026 CPI: gasoline +5.4% MoM, energy +3.8% MoM. Even as MoM moderates, YoY readings — gasoline +28.4% YoY, energy +17.9% YoY — confirm that the cumulative passthrough is still showing through in the second print.
Channel 3 ⎯ Shipping and insurance premia (baked in as long as the Hormuz disruption persists)
Hormuz disruption → tanker freight rates and war-risk insurance premia → import costs → core-goods import CPI
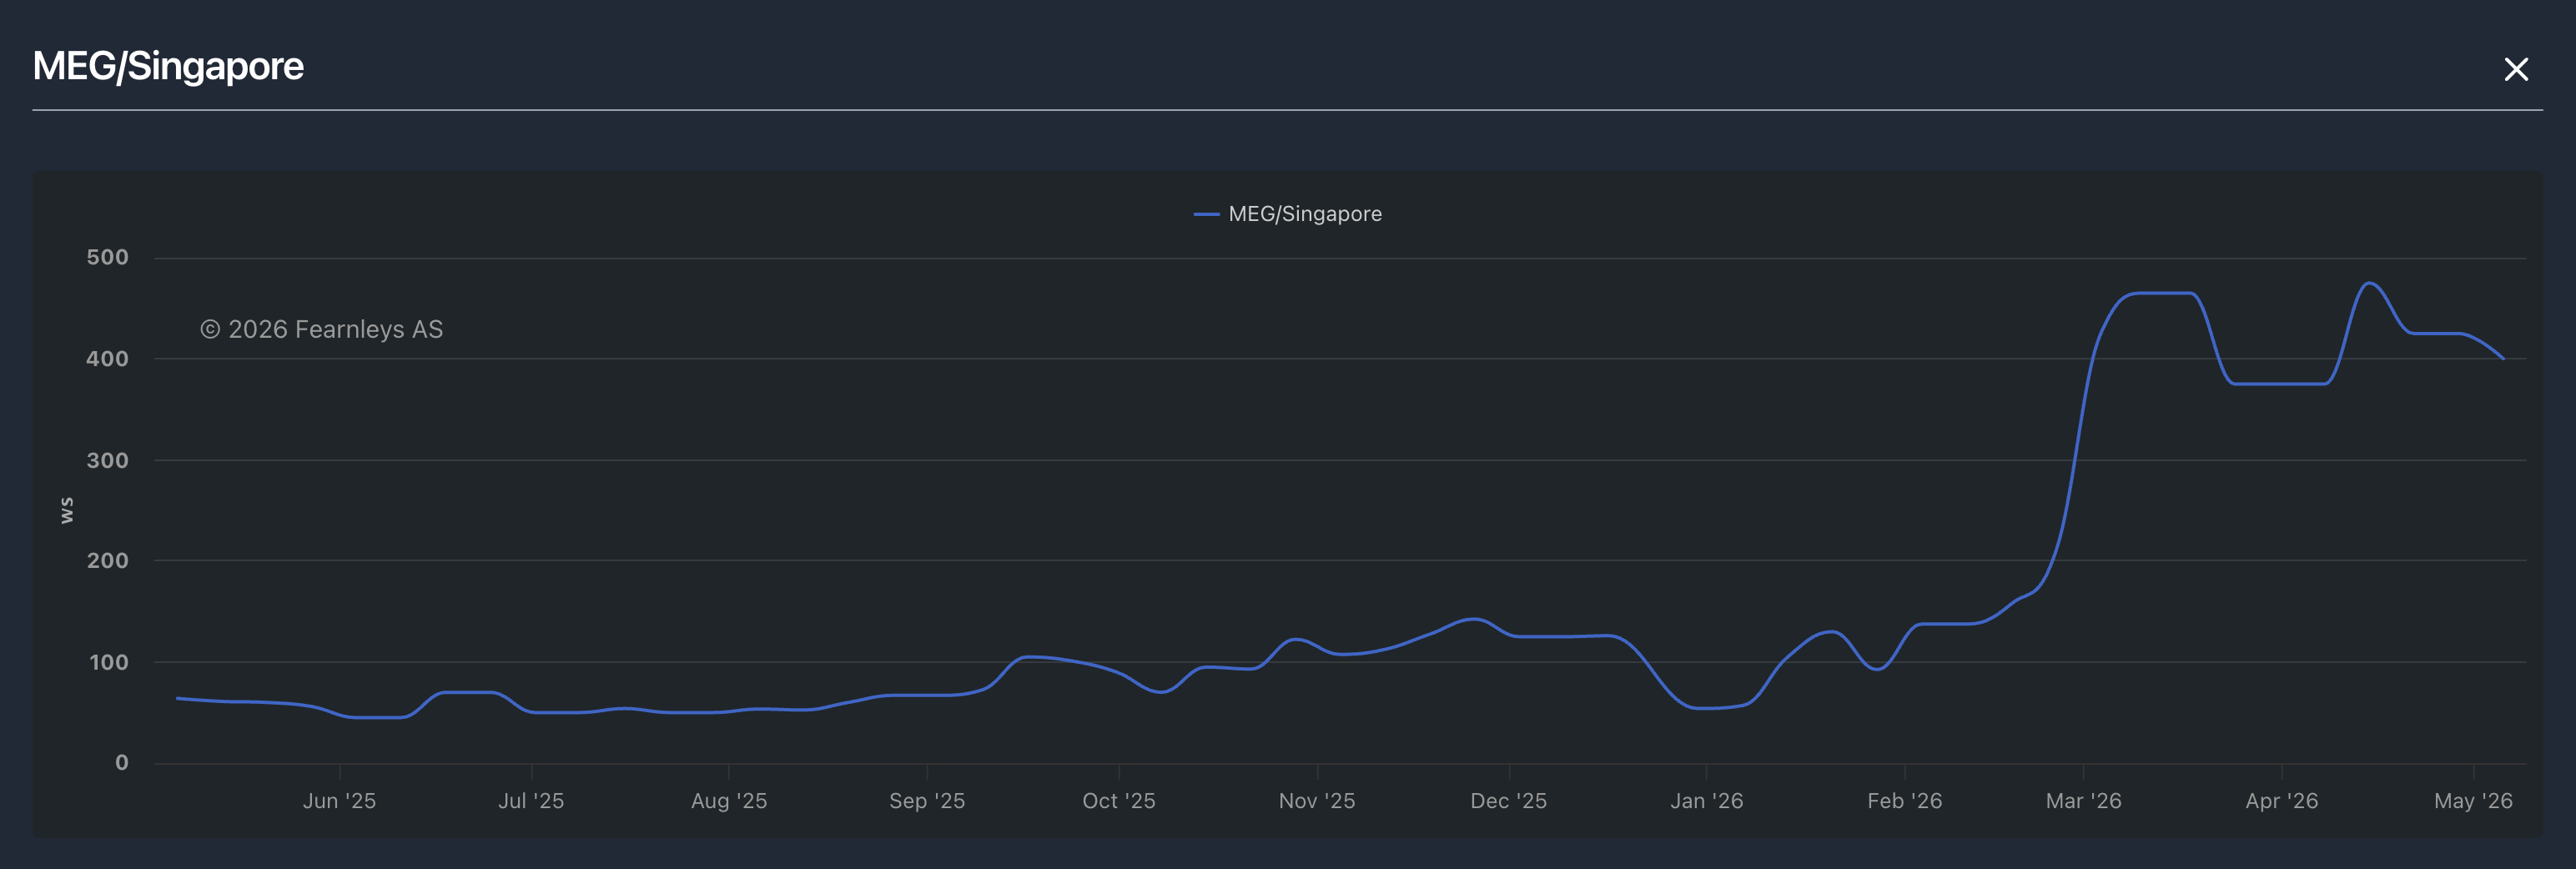
The VLCC freight index for Middle East Gulf → Singapore. (VLCC = Very Large Crude Carrier, a large crude tanker with roughly 2 million barrels of capacity.) The highest-traffic short-haul tanker route, serving Southeast Asia and China.
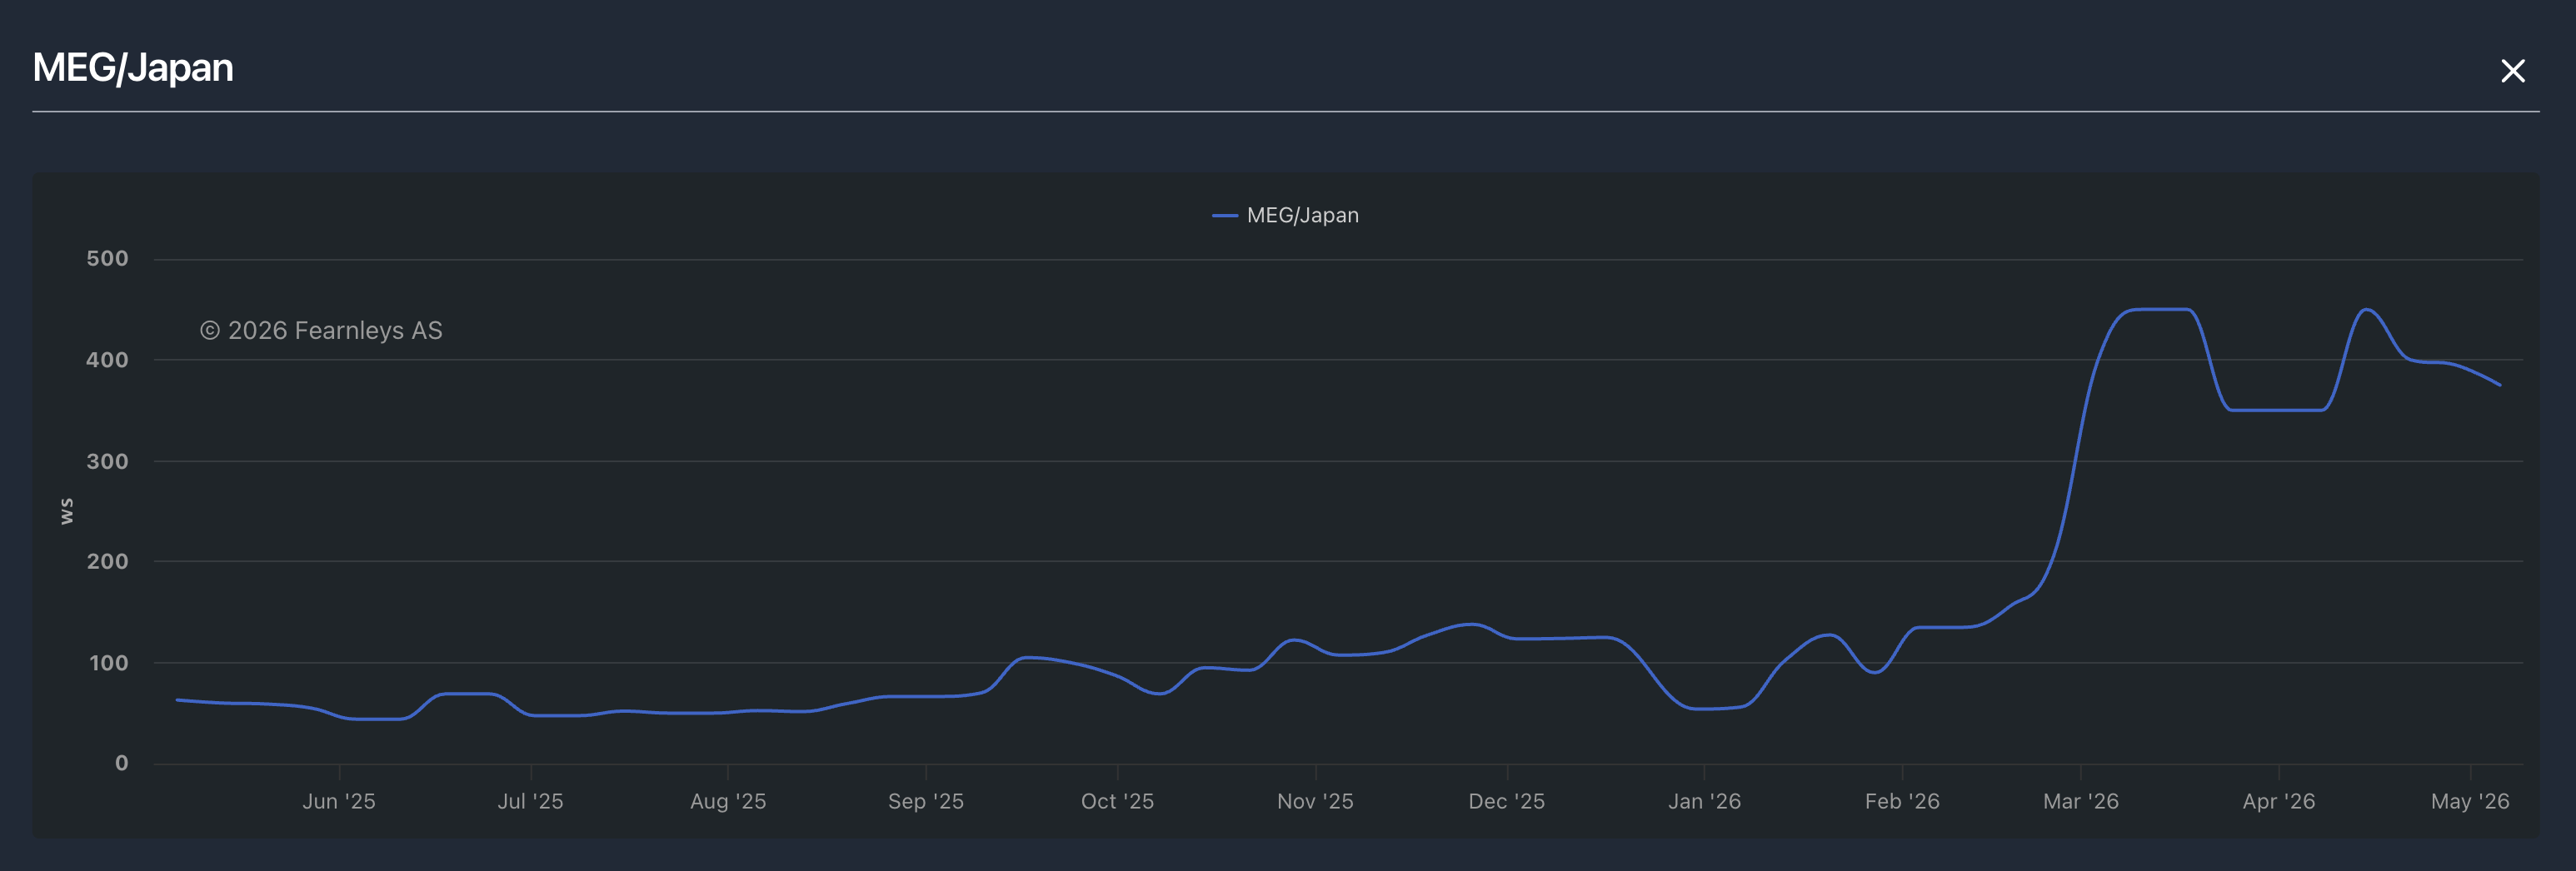
The VLCC freight index for Middle East Gulf → Japan. The mid-haul route serving Northeast Asia (Japan, South Korea, Taiwan).
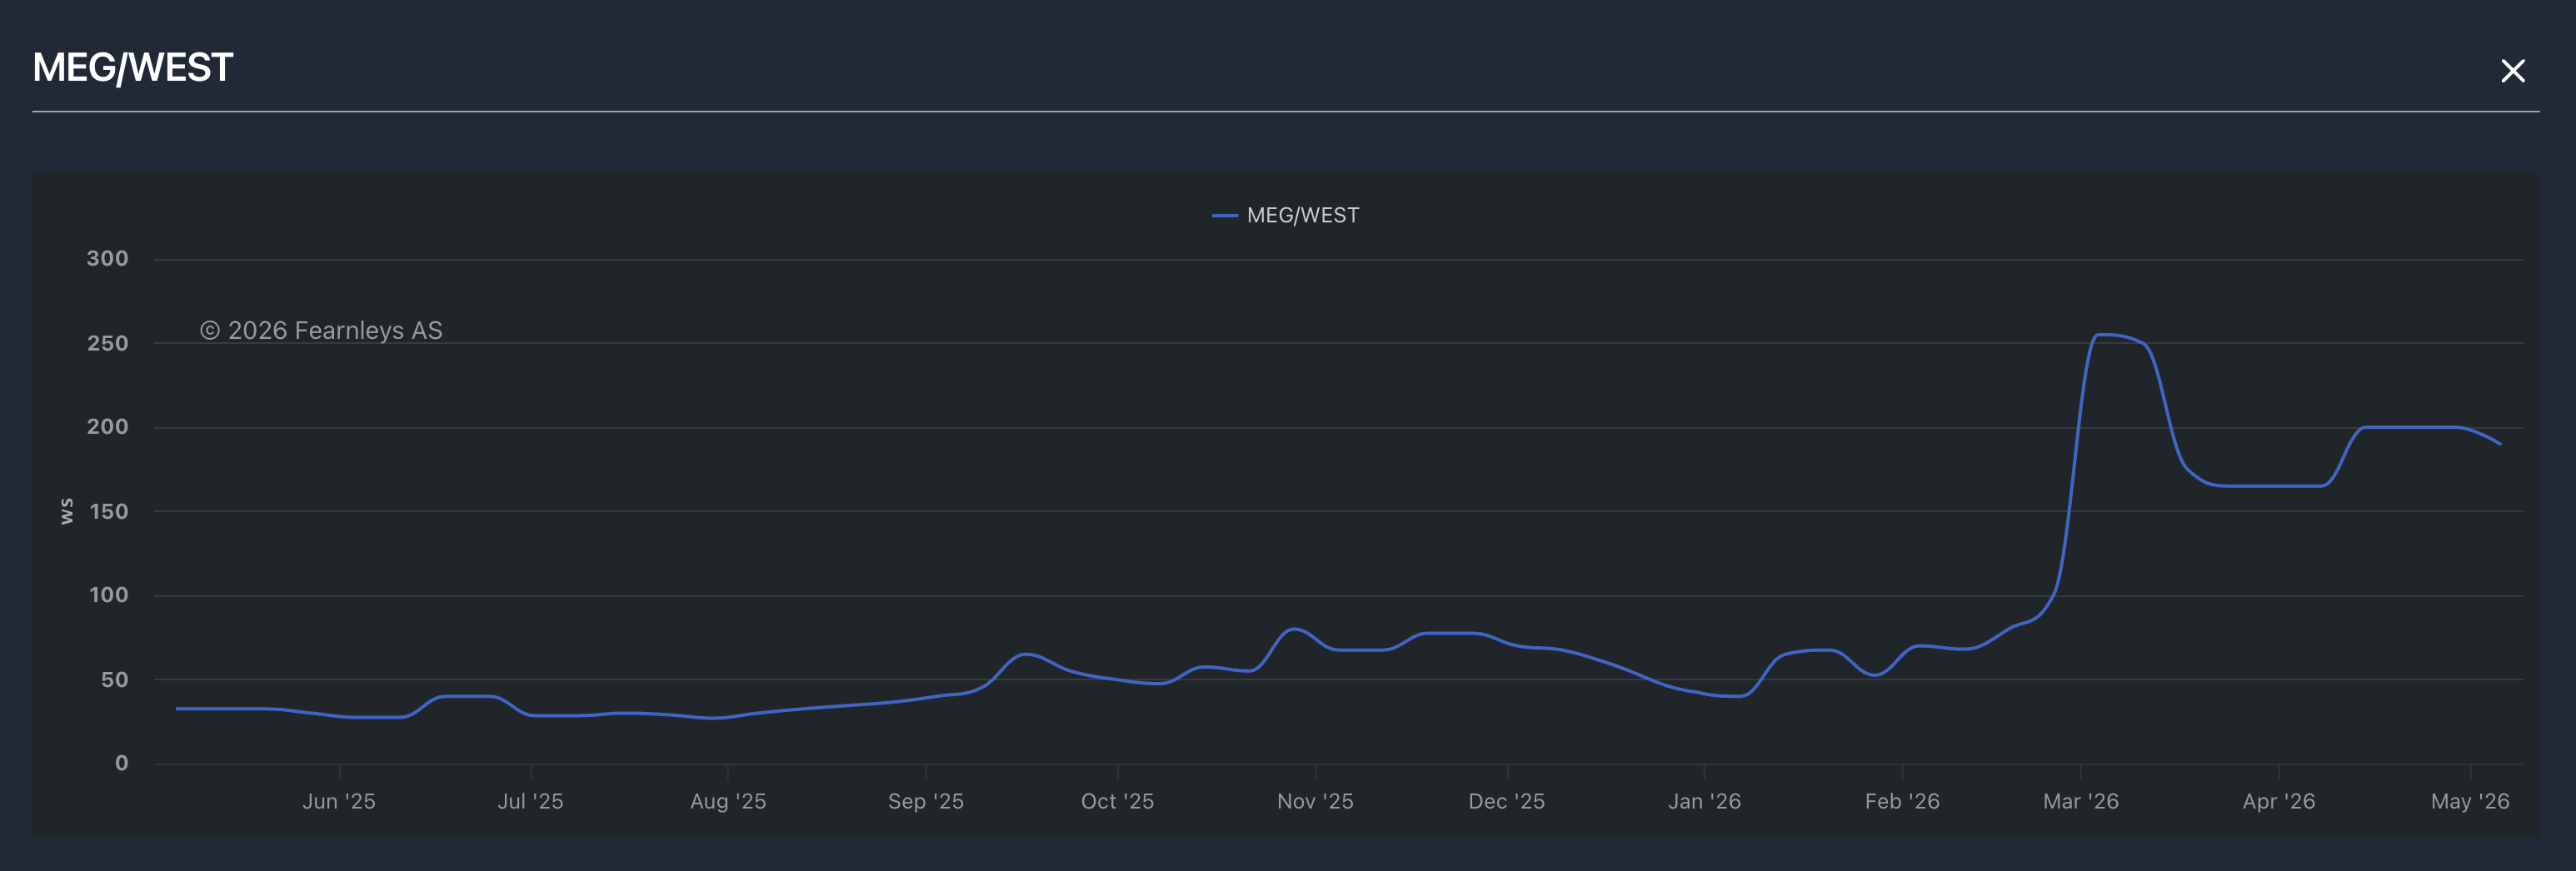
The VLCC freight index for Middle East Gulf → West (Europe, Americas). The longest-haul route, requiring a Suez or Cape of Good Hope detour.
- Tanker charter rates and war-risk insurance premia are all sitting above the pre-shock baseline.
- Roughly 20% of global seaborne oil and a meaningful share of LNG transit Hormuz → import cost premia accumulate in core-goods import prices.
- Iran's strike on the UAE on May 4–7 widened the premium again — until the disruption ends, this is a conditional cost.
Channel 4 ⎯ Inflation expectations (the slowest and most contested)
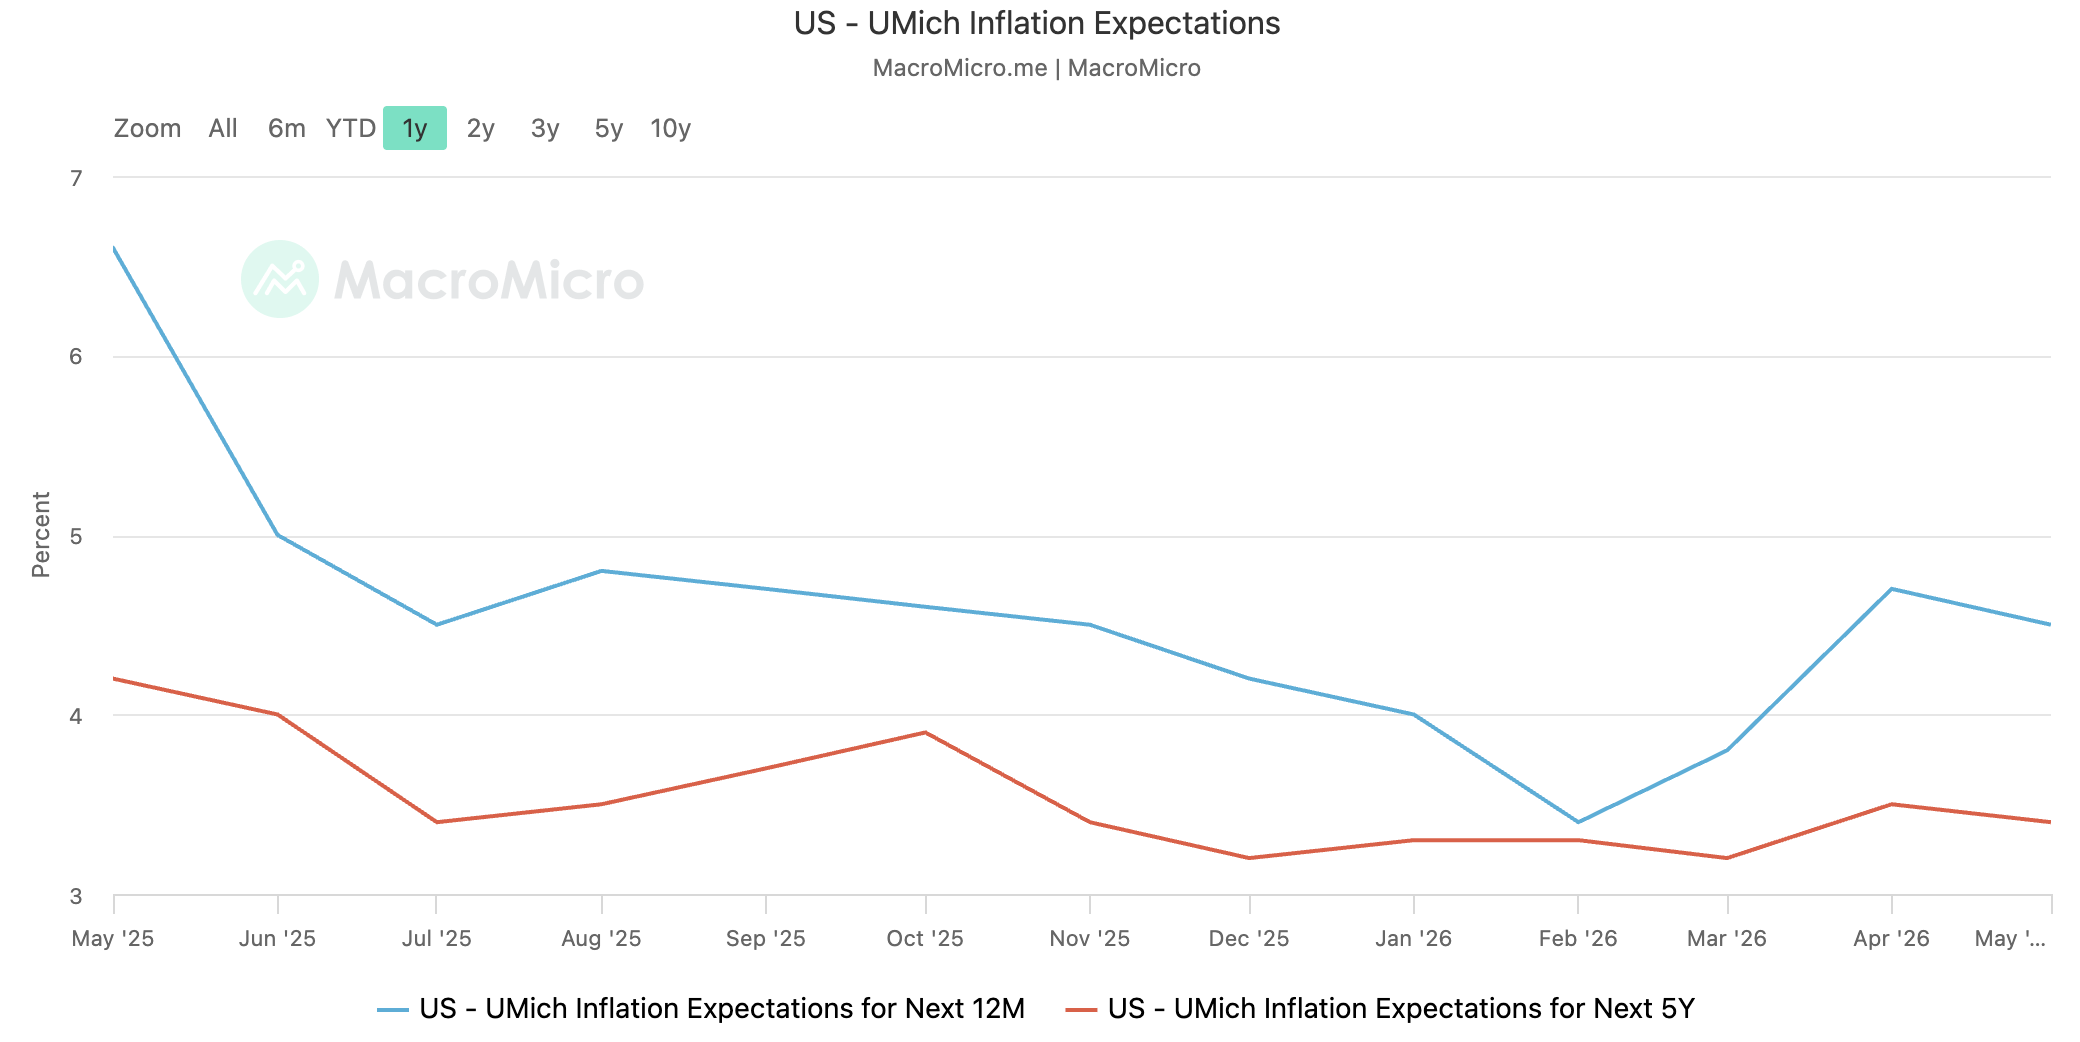
The case where sustained oil price increases manifest as household and market concerns about inflation persistence over the next 6–12 months. Observable as a re-steepening of the long-term inflation-expectation tail in the UMich / NY Fed surveys.
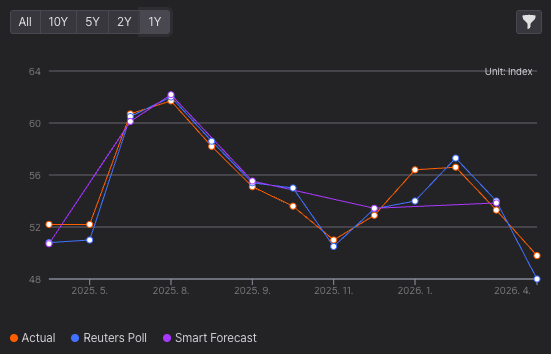
- Theoretically the most dangerous channel — if gasoline prices stay elevated, the long-term inflation-expectation tail in the UMich and NY Fed surveys re-steepens, and the Fed faces hold / hike pressure independent of how RMP is being run.
- That said, whether this channel actually fires with its historical sensitivity is itself an open question — discussed in detail below.
- If it does fire: the Fed's bill absorption collides directly with the inflation mandate, and the regime hits operational stress.
(4) Channel-by-channel read (as of May 2026)
| Channel | Status |
|---|---|
| 1. Inventory → core-goods | Partially priced, with more accumulation ahead (watch Q2–Q3 prints) |
| 2. Refined product → retail energy | Nearly priced (March 2026 CPI already reflects the spot move) |
| 3. Shipping / insurance premium | In progress; baked in as long as the Hormuz disruption persists |
| 4. Inflation expectations | Not yet priced; whether it fires at all is the question below |
(5) The possibility that channel 4's historical sensitivity has weakened
- For the channel 4 cascade — sustained elevated gasoline → reignition of inflation concerns → re-acceleration of core PCE → erosion of the Fed's RMP rationale → weaker bill absorption → term-premium repricing — to fire, the historical reaction function from oil shock to inflation-concern re-ignition needs to hold.
- However, circumstantial evidence has been accumulating that, since the shale revolution turned the US into a net oil producer, this reaction function may no longer behave the way it used to.
1) The limits of the simple supply-side cost-passthrough assumption
- The US is a net oil producer (production minus consumption > 0), so the GDP and income effects of higher oil prices are partially offset by gains in producer surplus against the rise in consumer costs.
- The monolithic "oil↑ → inflation↑ → rates↑" transmission frame from the 1970s through the early 2000s no longer maps cleanly onto today's US economy.
2) The non-response of expectations
- UMich 5–10Y inflation expectations have not departed meaningfully from their pre-conflict baseline, even ~10 weeks after the 2026-02-28 oil shock. The question isn't when channel 4 fires — it's whether it fires at all.
3) Recalibration of the Fed policy model's oil reaction function ⎯ FRB/US 2018 overhaul
The Fed's primary macroeconomic model for policy simulation, FRB/US — in use for more than 25 years — underwent a comprehensive structural overhaul in November 2018.
- Variables were trimmed from more than 500 to around 370, and several sectors were consolidated and simplified.
- The most consequential change for the oil-shock reaction function was the complete removal of energy as a factor of production.
FRB/US overhaul (additional context)
The prior model included energy alongside labor and capital as a factor of production, so an oil price increase automatically activated a supply-side path: "higher production costs → lower potential output." Two reasons the Fed removed that path:
- Historically, energy price movements rarely contributed more than 0.1pp to potential output growth — the channel added little to model accuracy.
- After the shale revolution fundamentally changed the US energy production structure, the prior treatment of energy as exogenous no longer fit reality. Keeping energy as a production factor would have required building a new endogenous energy-production module, and the complexity was deemed unjustified relative to the marginal gain.
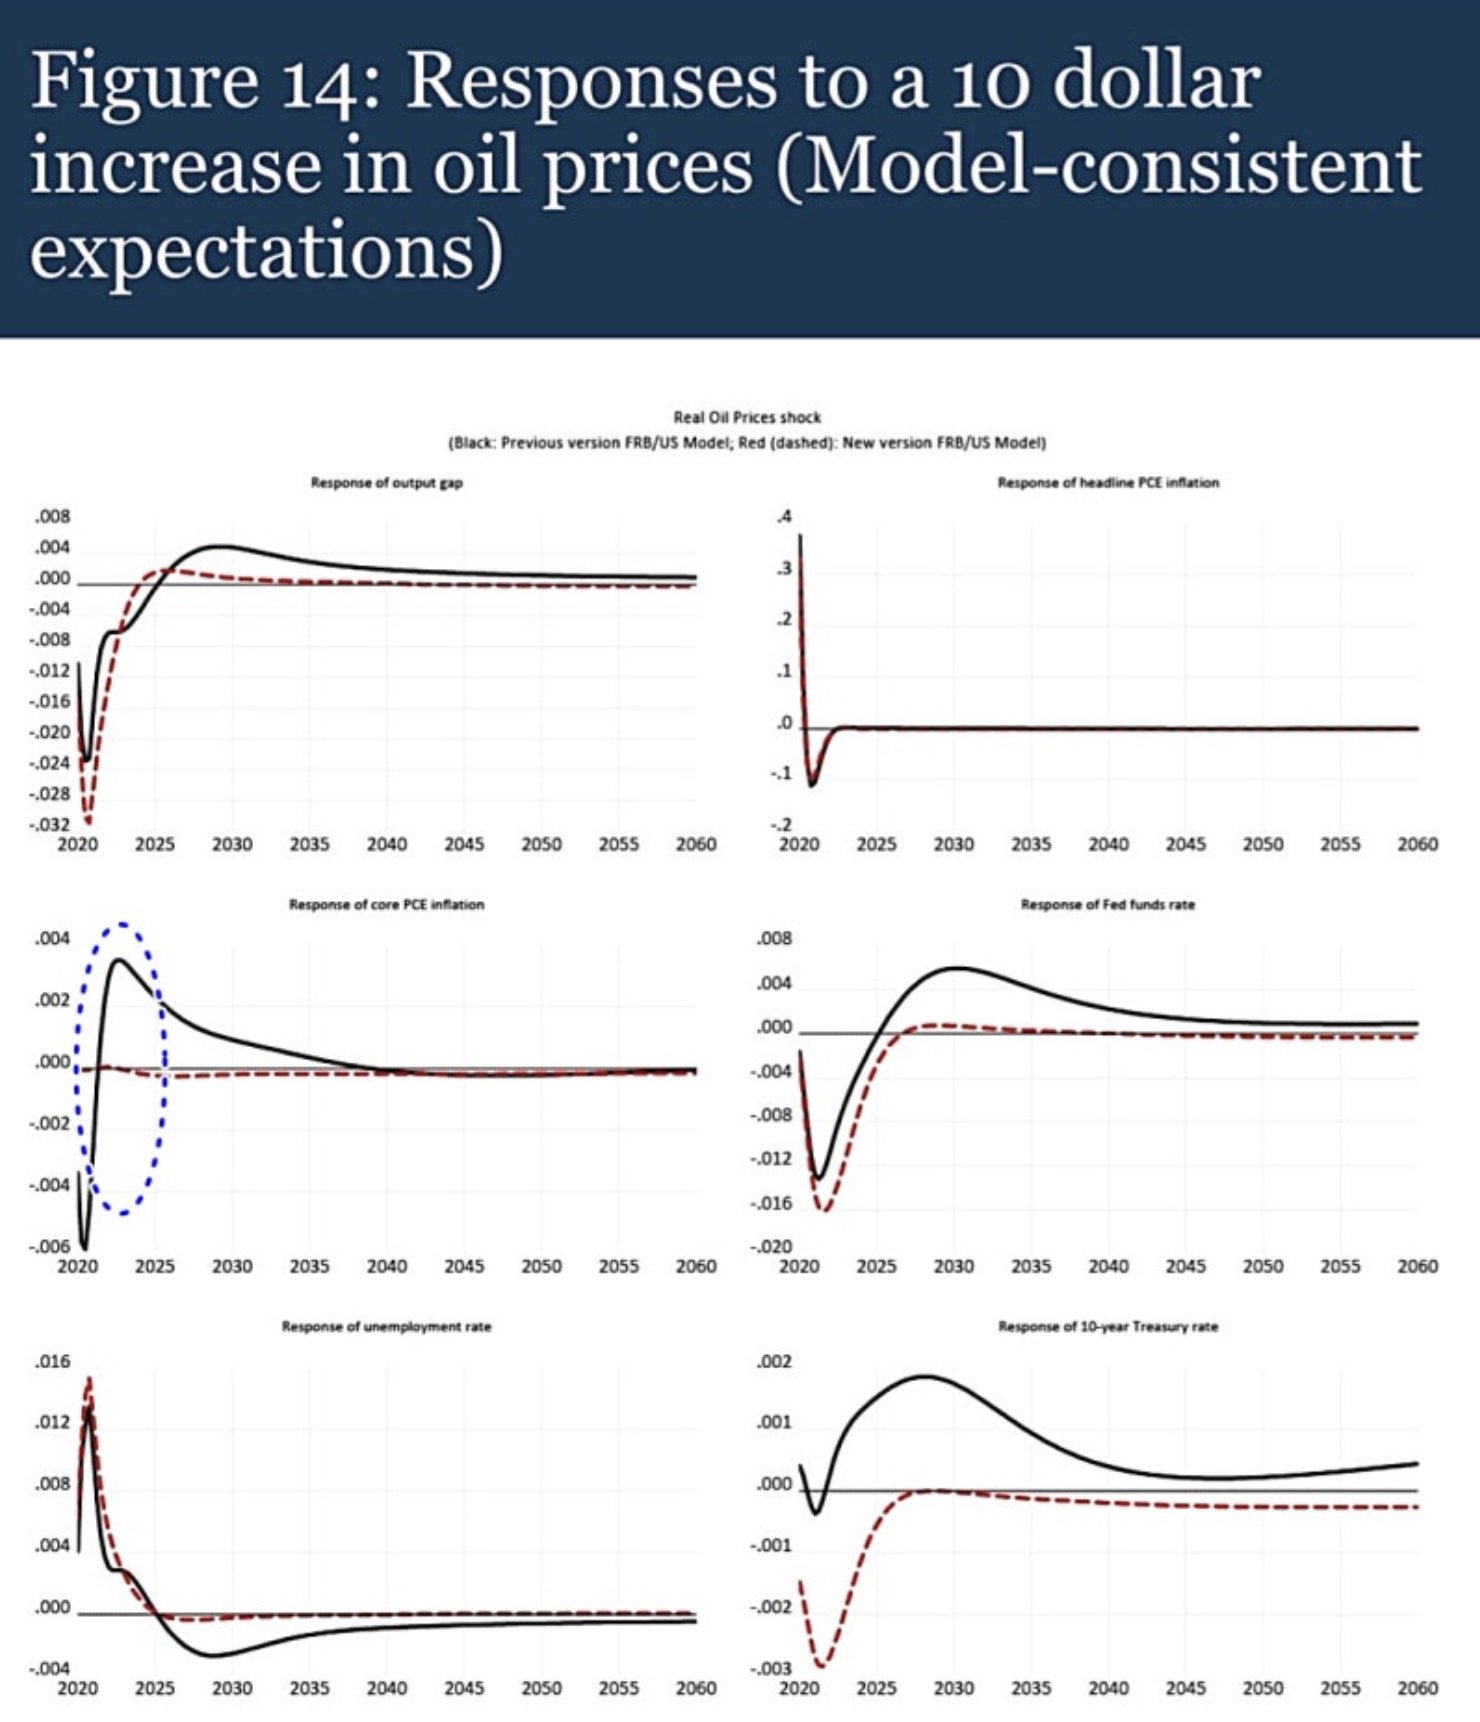
As a result of this change, the macroeconomic response to an oil shock looks structurally different. Comparing the impulse response to a $10 real-oil-price shock:
- Old model: supply path (cost pressure) and demand path (household purchasing-power decline) fire simultaneously
- → a stagflationary response with output contraction alongside higher inflation.
- → core PCE turns positive, constraining the depth of rate cuts,
- → and the policy path subsequently wobbles toward hikes.
- → the 10-year yield ticks modestly higher.
- New model: the supply path is gone; only the demand path remains.
- The contraction in non-energy demand creates disinflationary pressure that overwhelms second-round effects (the self-reinforcing wage-price loop in which an initial oil-driven headline inflation increase leads to nominal-wage hikes → corporate cost passthrough → further price increases → another round of wage hikes, spreading from headline into core inflation).
- Core PCE doesn't respond. The policy rate cuts deeper and more consistently to respond to the output contraction. The 10-year yield falls.
In other words, the 2018 overhaul reshaped the model so that the traditional "oil↑ → inflation↑ → rates↑" frame no longer fires automatically inside the Fed's policy model.
- The caveat is that the estimation vintage is 2018 — the pandemic, supply-chain disruption, and the 2021–22 inflation spike likely altered the underlying economic structure further.
- We can't verify from public information whether the current FRB/US still carries the same reaction function.
- Nonetheless, the fact that the Fed's policy model has demonstrated a different reaction function to oil shocks is itself a meaningful reference point for assessing the oil–inflation–rates relationship today.
We can't observe the Fed's actual internal policy model from outside. Both scenarios — the historical cascade as base case, and the weakened sensitivity as base case — have to be held open.
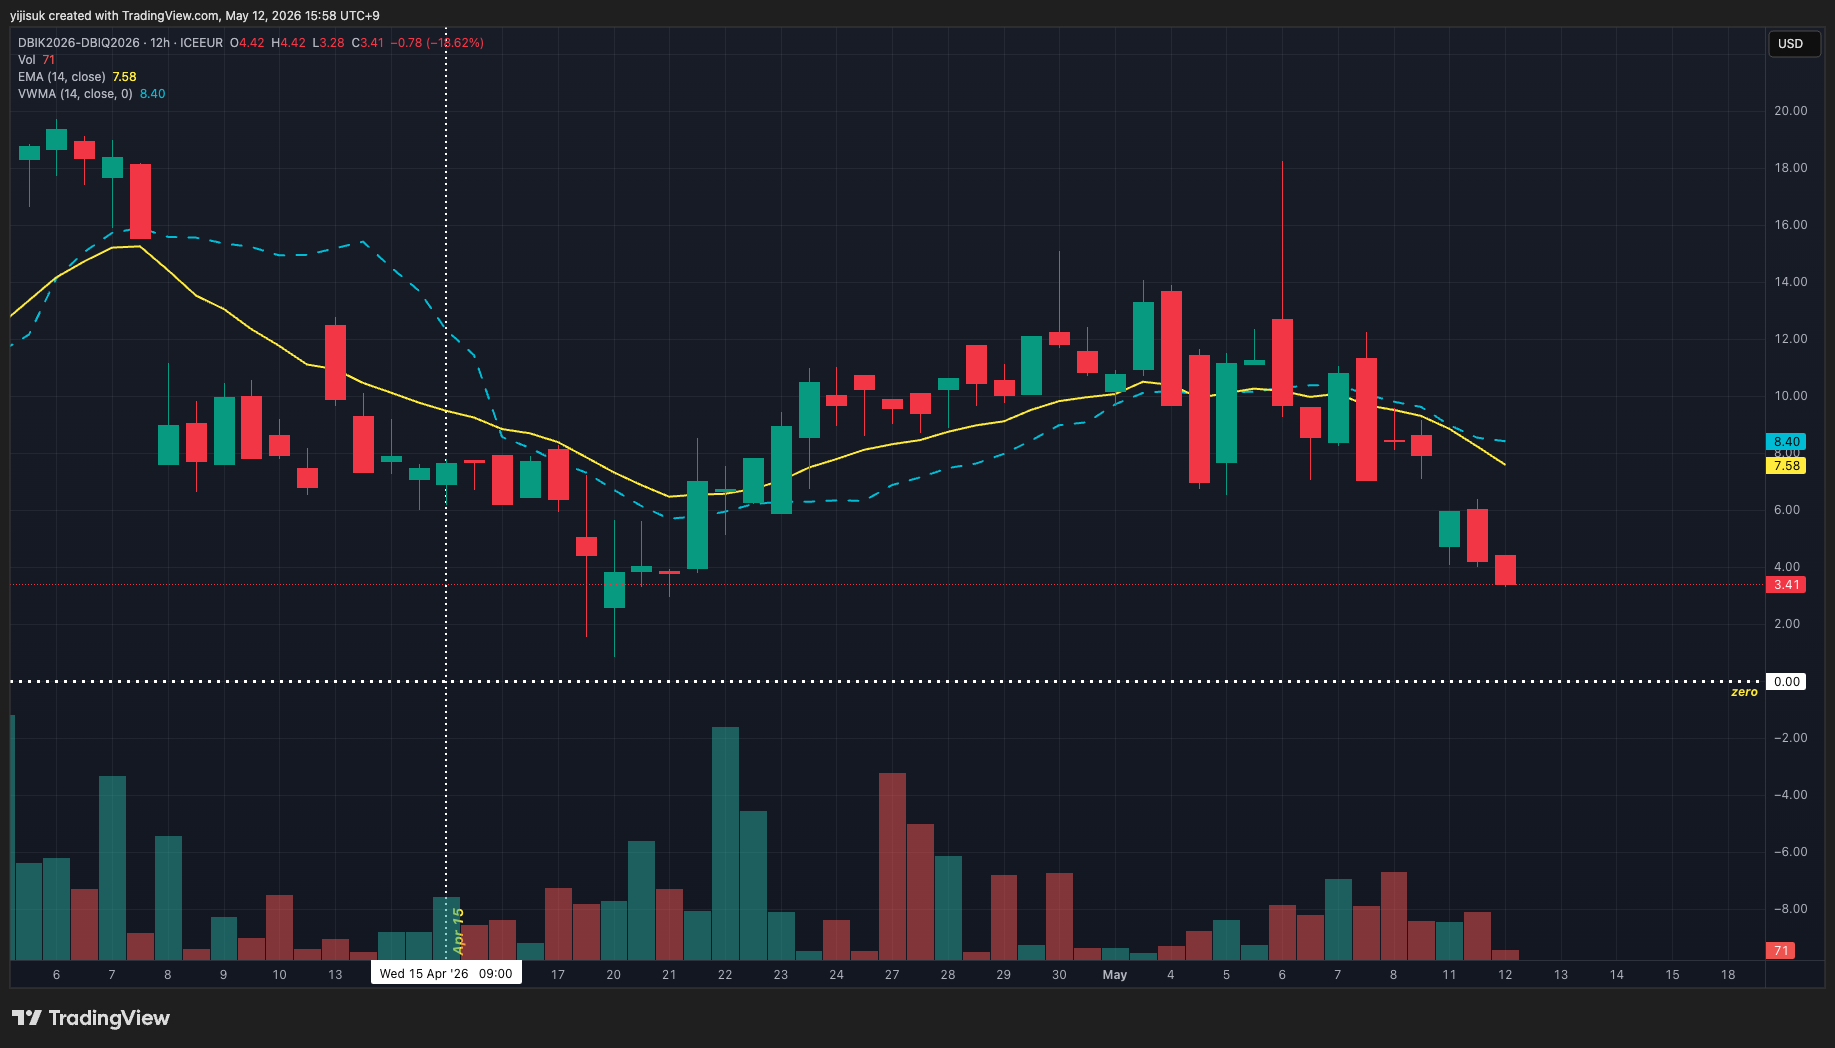
(6-1) Mid-channel data check: headline and core PPI
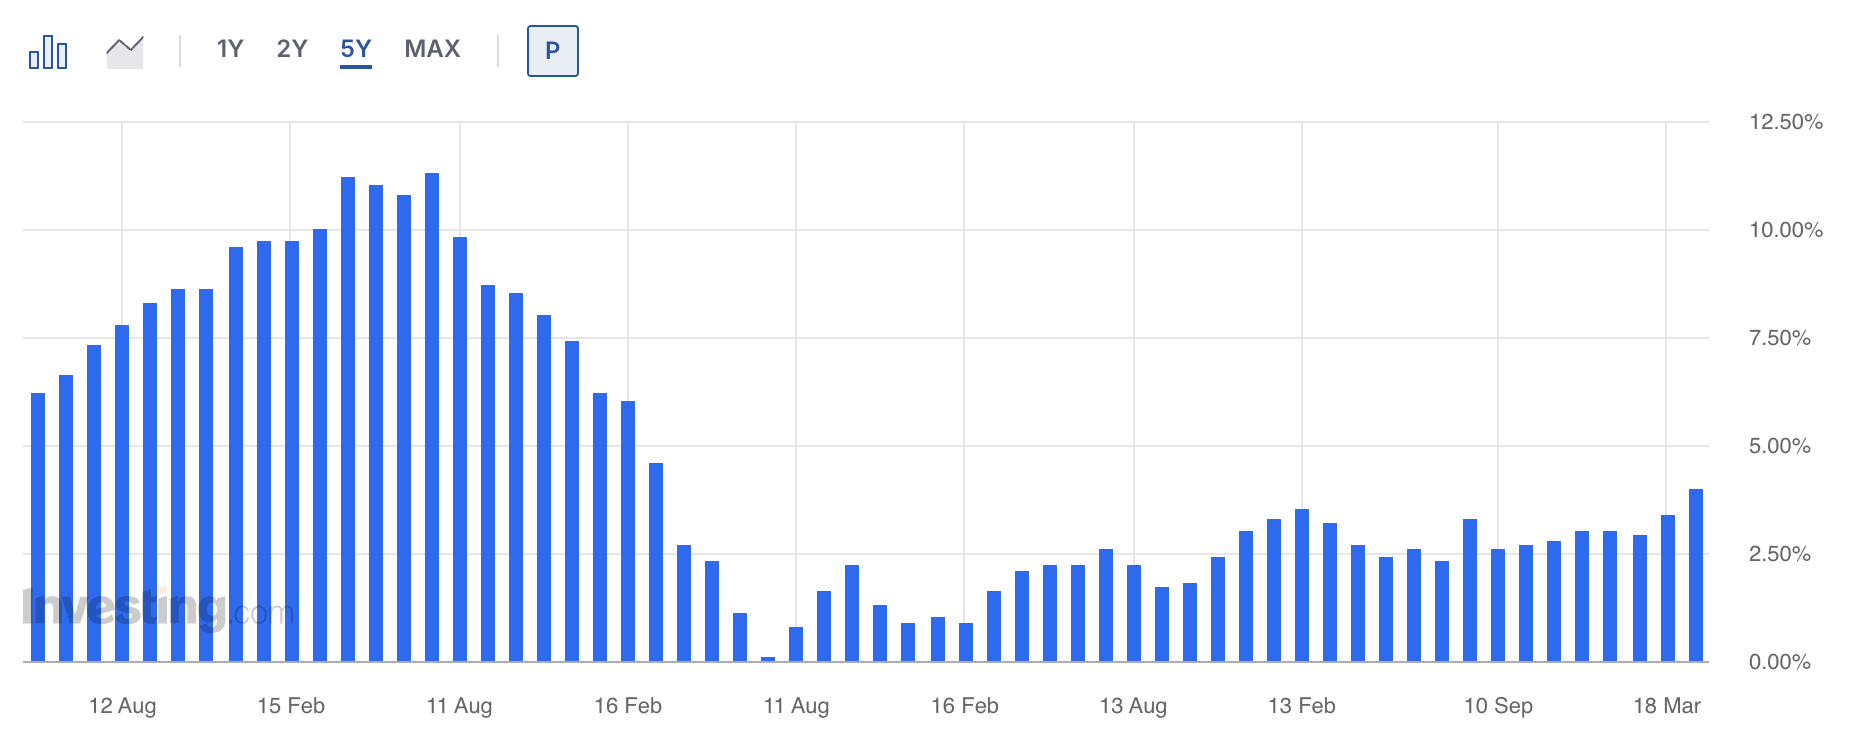
Headline PPI YoY change trend, last 5 years.
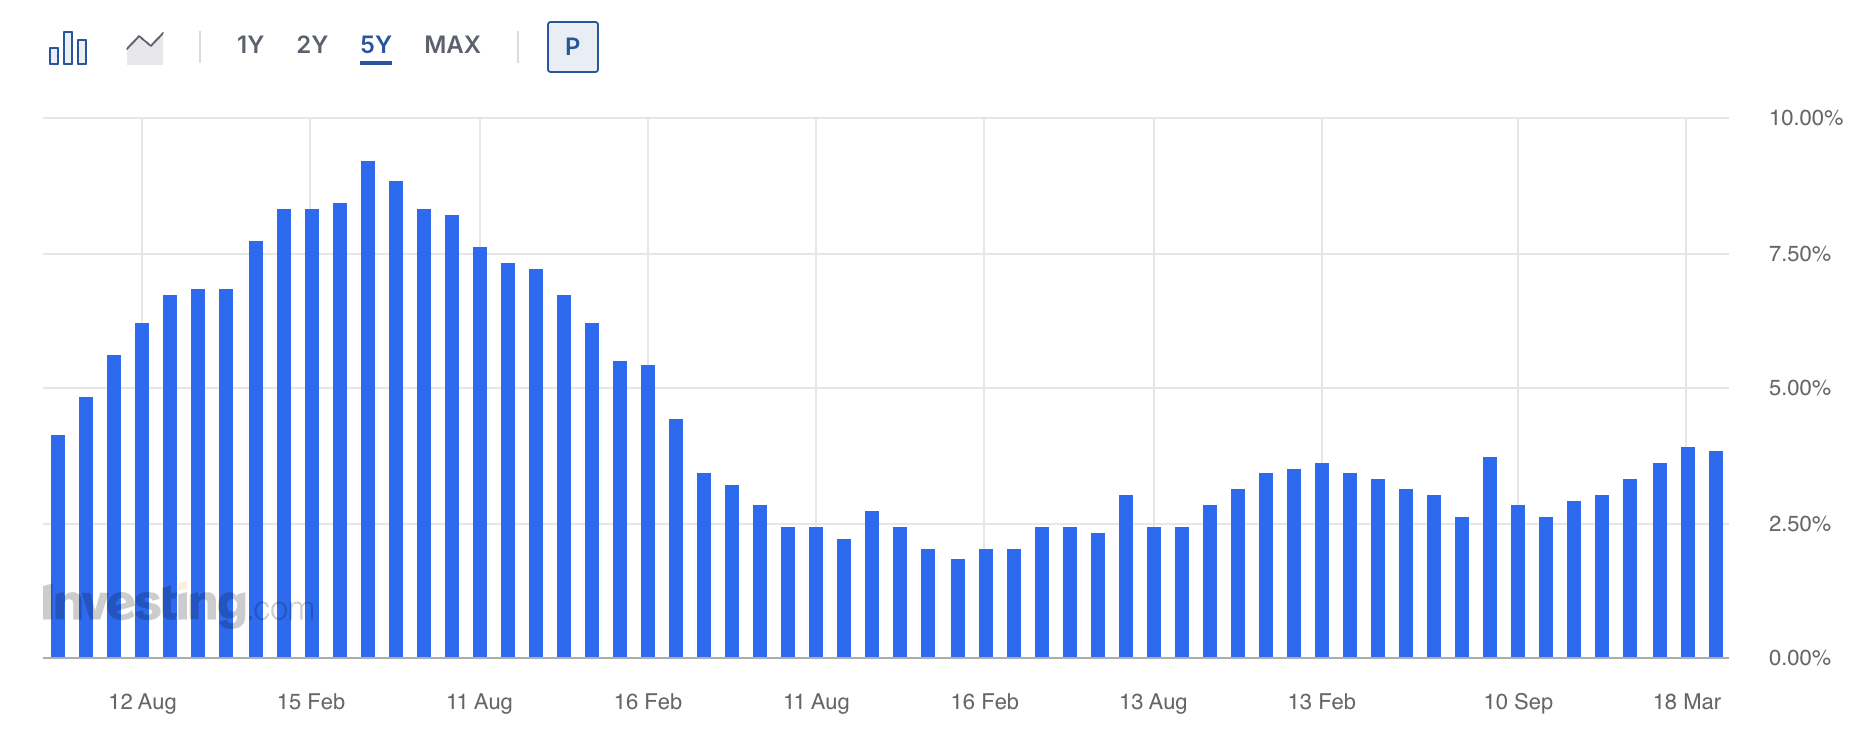
Core PPI YoY change trend, last 5 years.
The first place direct data lets us do a partial read is PPI. From the latest release (BLS, January 2026 data, released February 27, 2026 — the February release was pushed to March 18 due to the government shutdown):
- Final demand PPI: +0.5% MoM, +2.9% YoY. YoY has been drifting up from the April 2025 trough of +2.4%.
- That said, the January 2026 release predates the February 28 oil shock — channel 1–3 effects from this episode haven't entered PPI yet.
- Final demand goods: −0.3% MoM (energy −2.7% MoM, gasoline −5.5% MoM — energy was a deflationary contributor in January). Stage 1 intermediate demand, by contrast, came in at +0.6% MoM and +4.0% YoY — upstream input costs are still trending up.
- The takeaway: on a longer-horizon basis, PPI YoY sits inside a manageable range (2022 peak ~11% → 2024 trough ~1% → currently ~3%), with energy's contribution oscillating in both directions. The real Feb 2026 oil-shock effect will start filtering in from the March 18 release (the February 2026 data) onward.
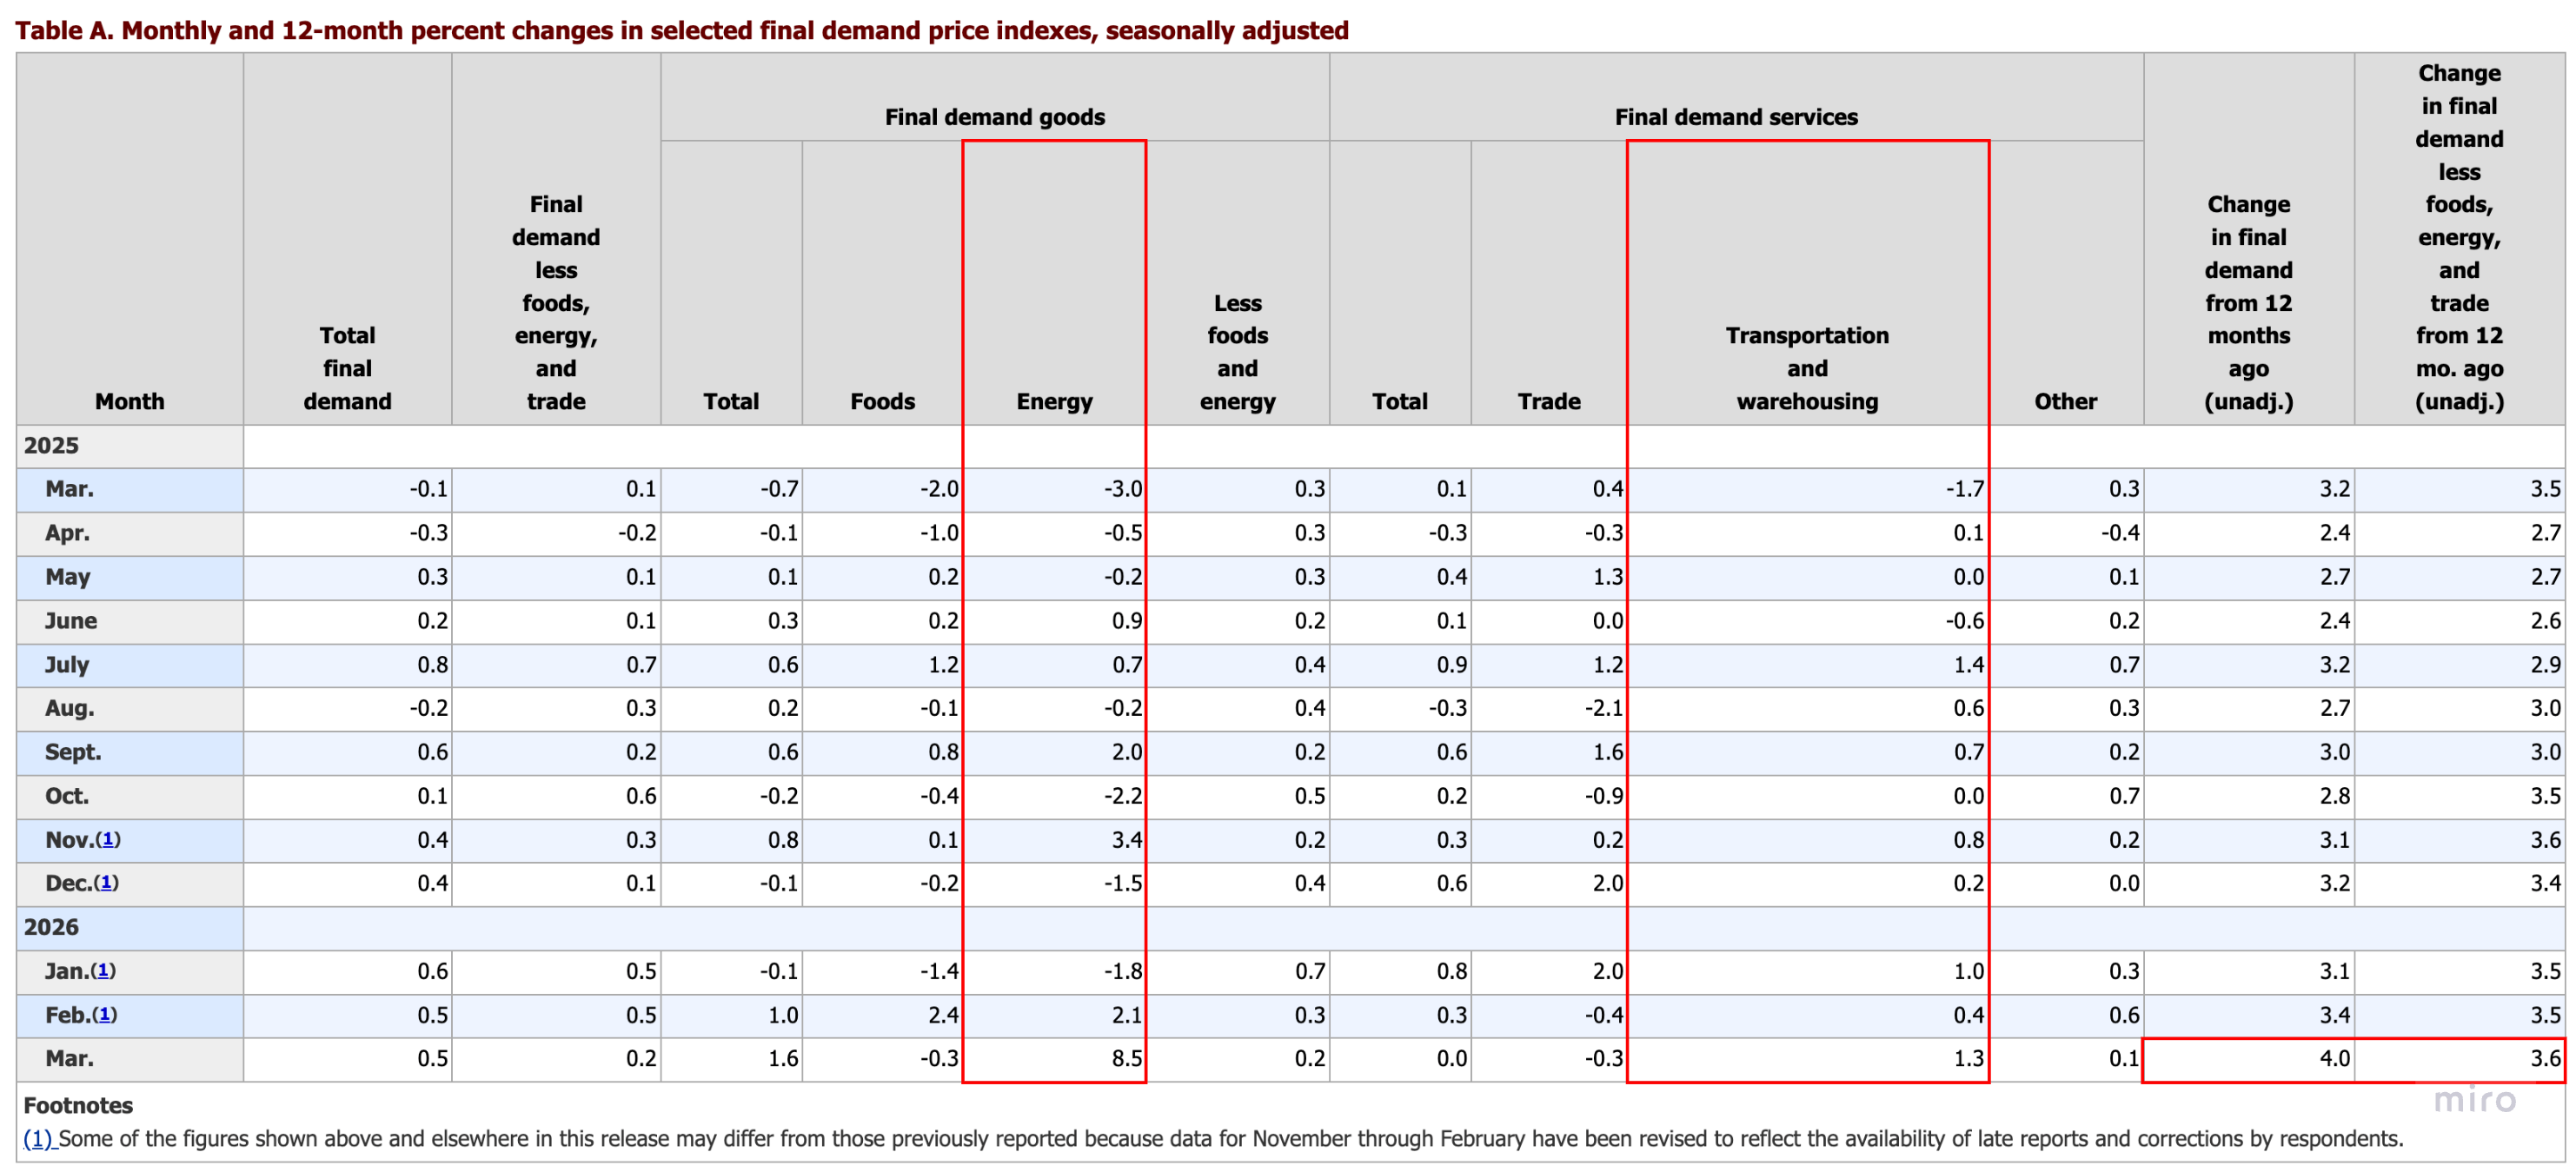
(6-2) Mid-channel data check 2: the Dubai futures spread ⎯ the disruption's forward repricing
The Dubai crude futures curve — the benchmark most physically exposed to the Hormuz closure — gives us the cleanest read on how the market is updating its view:
- The front-month spread (the chart's 1M) is easing. The spread that spiked to 4.70 in late April has retraced to 2.89 by May 12 — buying pressure built around "there's not enough crude right now" has weakened relative to the short-term past.
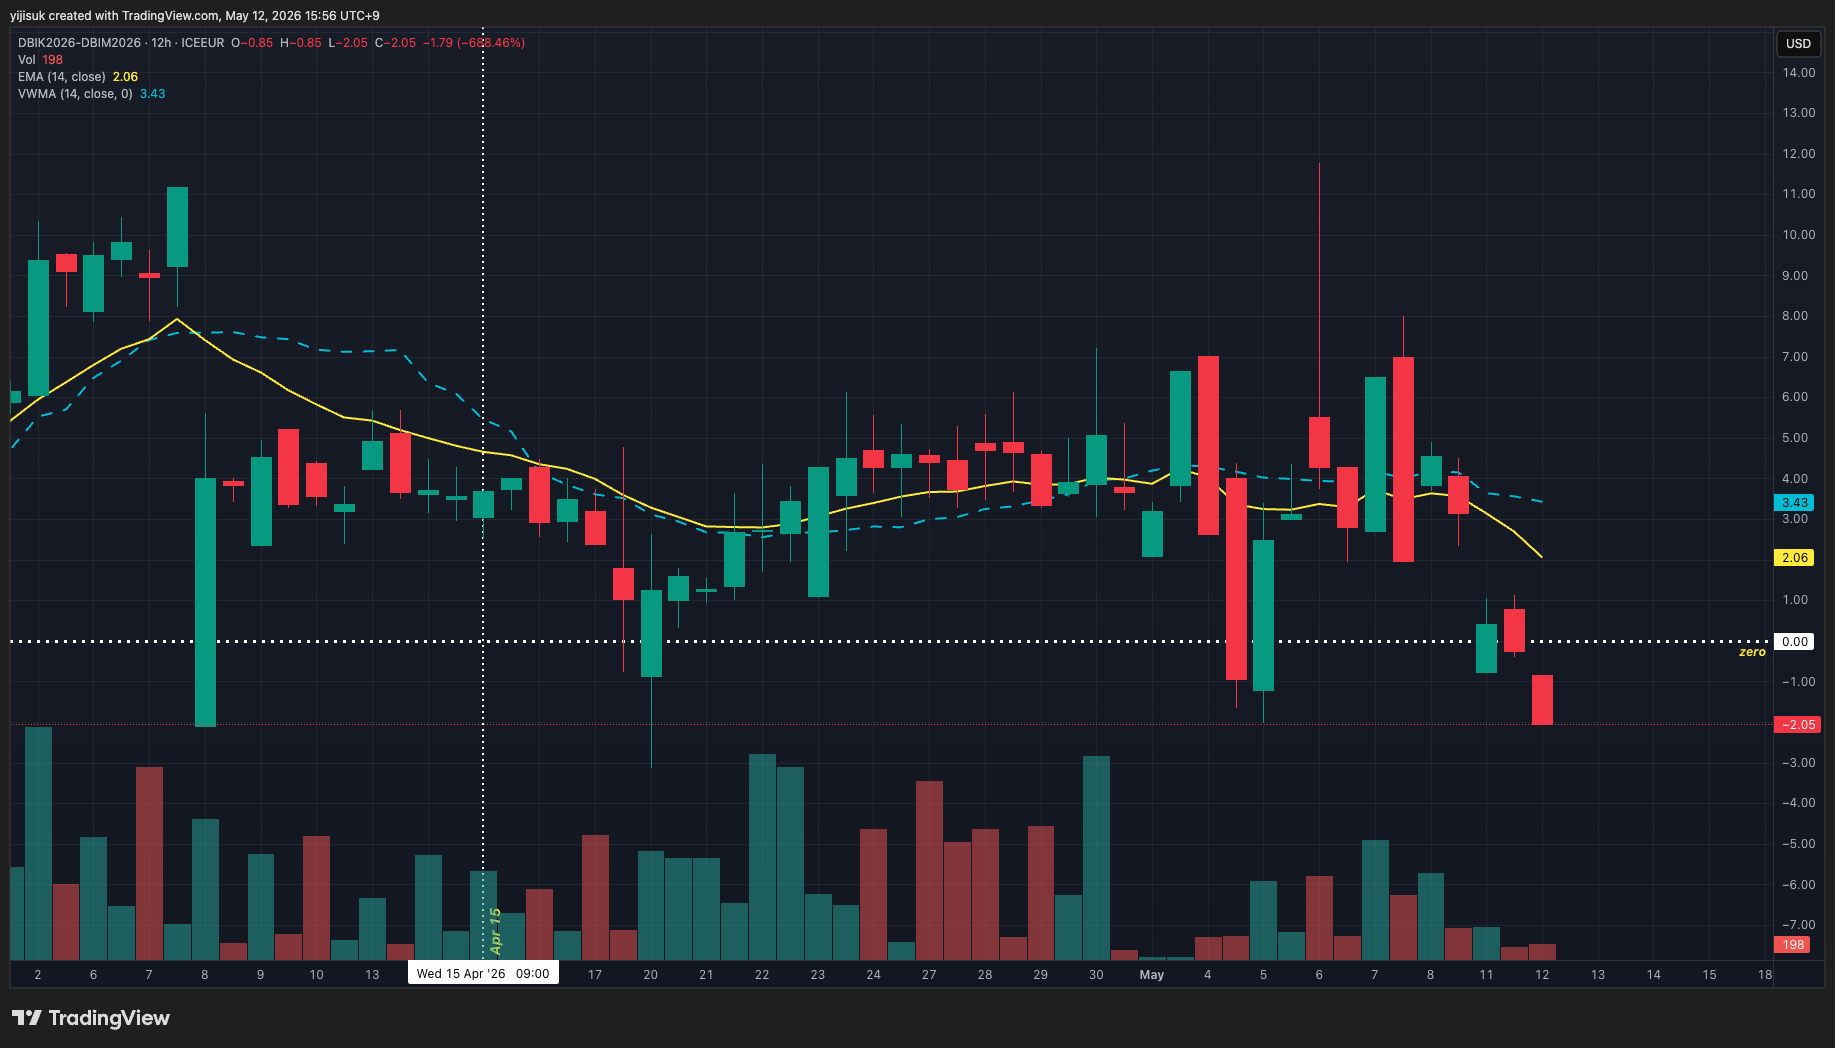
DUBAI CRUDE MAY-JULY 2026 SPREAD
DUBAI CRUDE MAY-AUG 2026 SPREAD
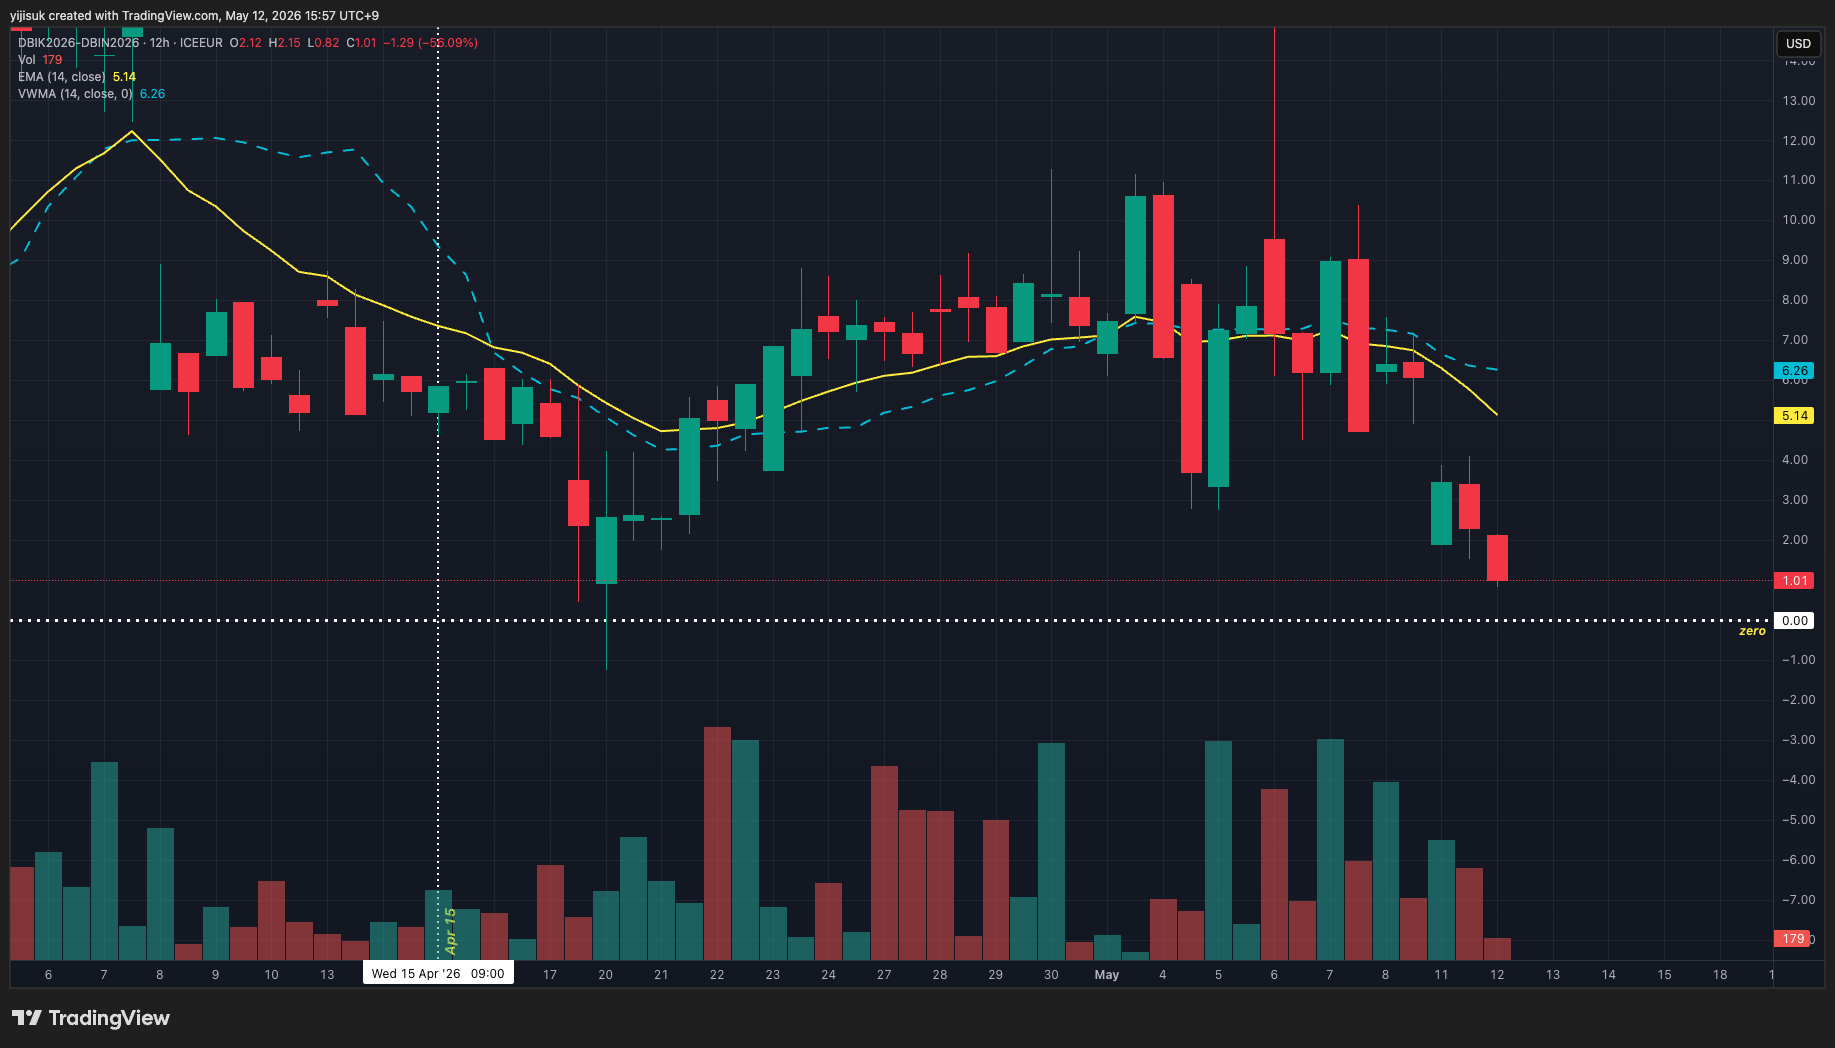
- The tension two and three tenors out (July–August 2026 delivery, the chart's 2M and 3M) has actually deepened. They closed May 12 at +12% and +22% above their April 15 levels — a signal that the market's worry has shifted from "now" to "summer."
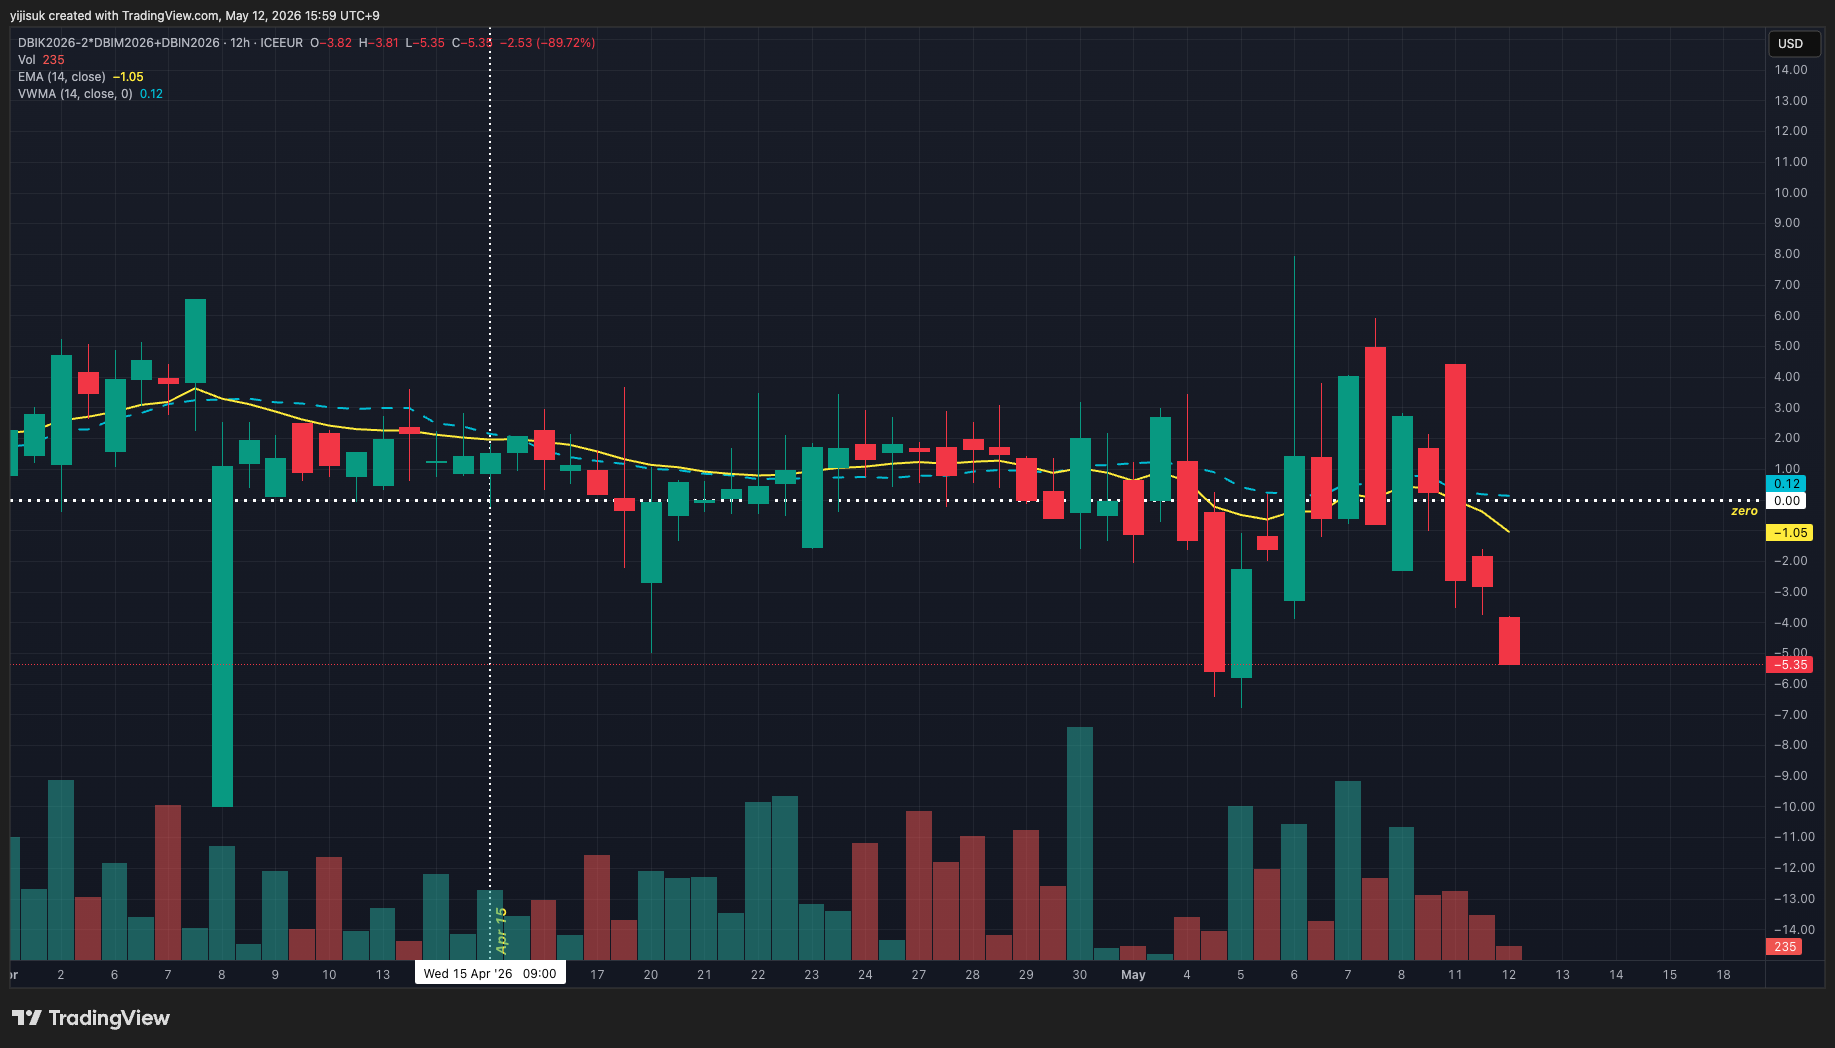
- The curve shape itself has flipped (the chart's 1-2-3 butterfly). It moved from positive in mid-April to negative on May 12 — reshaping from a front-loaded "spot squeeze" pattern into a belly-loaded "summer-delivery stress" pattern.
Putting it together,
- the easing of the 1M spread between May and June isn't a sign that the Hormuz closure is unwinding.
- It's the market repricing the same disruption forward into the summer (June–August) delivery window.
- If the 1-2-3 butterfly stays negative while the July–August spreads continue building, Hormuz hardens not into a "transient shock" but into a "delayed escalation" scenario.
(7) To summarize,
- Gasoline price increases have meaningfully shown up in March CPI, so "zero impact of the oil shock on the US" is unrealistic.
- At the same time, the simple supply-side cost-passthrough assumption is also unrealistic given the US's status as a net oil producer.
- The current cautious base case sits somewhere between the two extremes — channels 1–3 are in motion, but channel 4's reach may run weaker than its historical level. Decisive evidence requires watching the energy-cost contributions across the February–May 2026 PPI / CPI / PCE prints, plus continuous monitoring of UMich inflation expectations.
In Part 3, we lay out the specific failure modes these transmission channels can drive into, and the tentative conclusion on which scenario the market's current price is reflecting.