Q4 2025 Macro Liquidity Check

1. Liquidity Environment
The indicators most representatively monitored when checking the tape ultimately reduce to "liquidity." "Row while the tide is in" involves two actors — (a) the one who actually lets the water in, and (b) the one who rows on time. Most market participants are the latter.
The flow of liquidity is, broadly, a game of sentiment and momentum. Market sentiment is like an organism whose state can be read through:
- (a) Alive or dead: real-economy indicators (the most fundamental data)
- (b) Persistence: the rate level of the short-term funding market
- (c) Final outcome: the Treasury General Account (TGA) and reserve balances
Here we read the liquidity environment via (b) and (c) over September–October.
2. The Structure of the Short-Term Funding Market
The short-term funding market in which MMFs operate splits by the structure of the cash trade — secured vs unsecured.
- Secured market: centered on repo, mostly overnight collateralized trades.
- Unsecured market: centered on CP (commercial paper), CDs (certificates of deposit), deposits, FF (federal funds).
The point: MMFs operate via mutual lending, and whichever market they participate in there is always a cost of borrowing. Each market's rate, and the spread between rates, is an important proxy for the sentiment of MMF-market participants.
3. The Unsecured Market
(1) Effective Federal Funds Volume
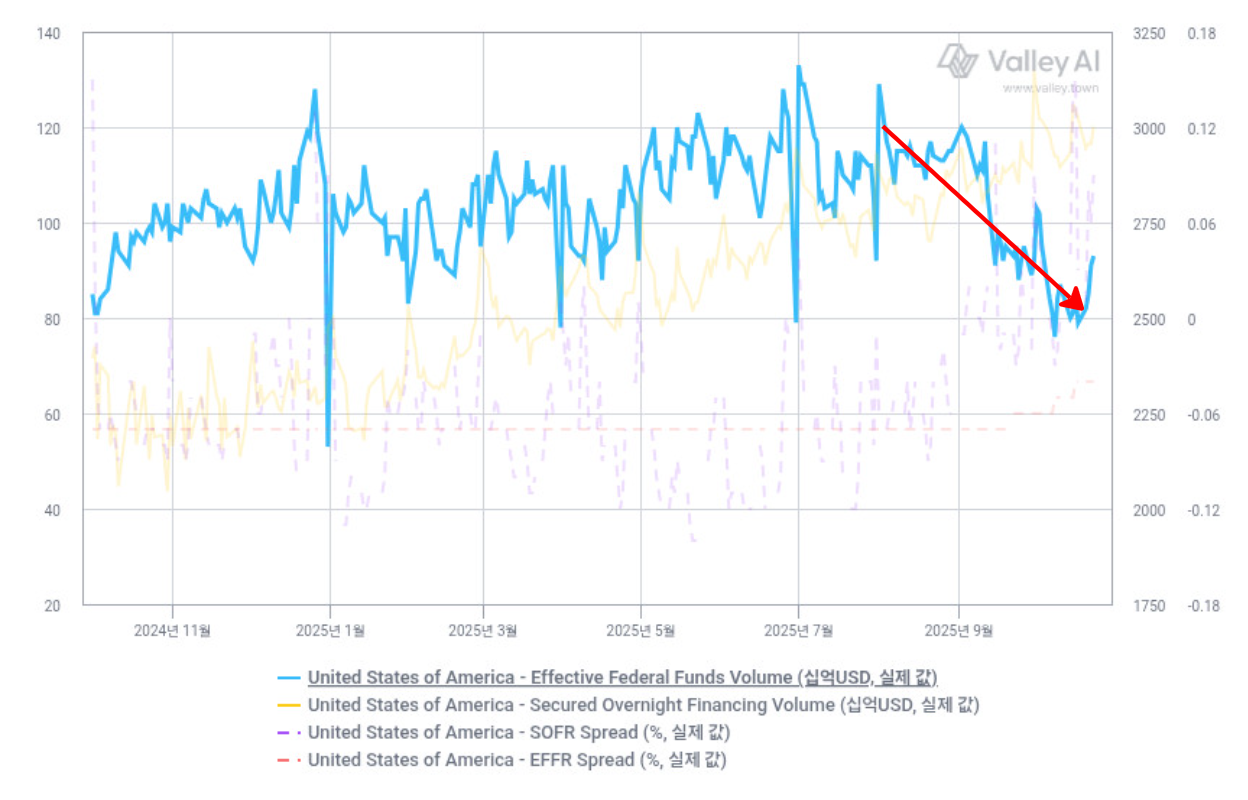
The federal funds market is where banks lend / borrow reserves to each other overnight, unsecured.
- Falling volume means the market's vitality is declining. A shrinking market implies reduced incentive for banks to fund / deploy there, or that counterparty-risk concern is making them avoid trades.
- It may also be structural. Monetary policy like QT can shrink system-wide reserves so that the federal funds market's role itself contracts vs the past — a structural shift in progress.
(2) The EFFR–IORB spread
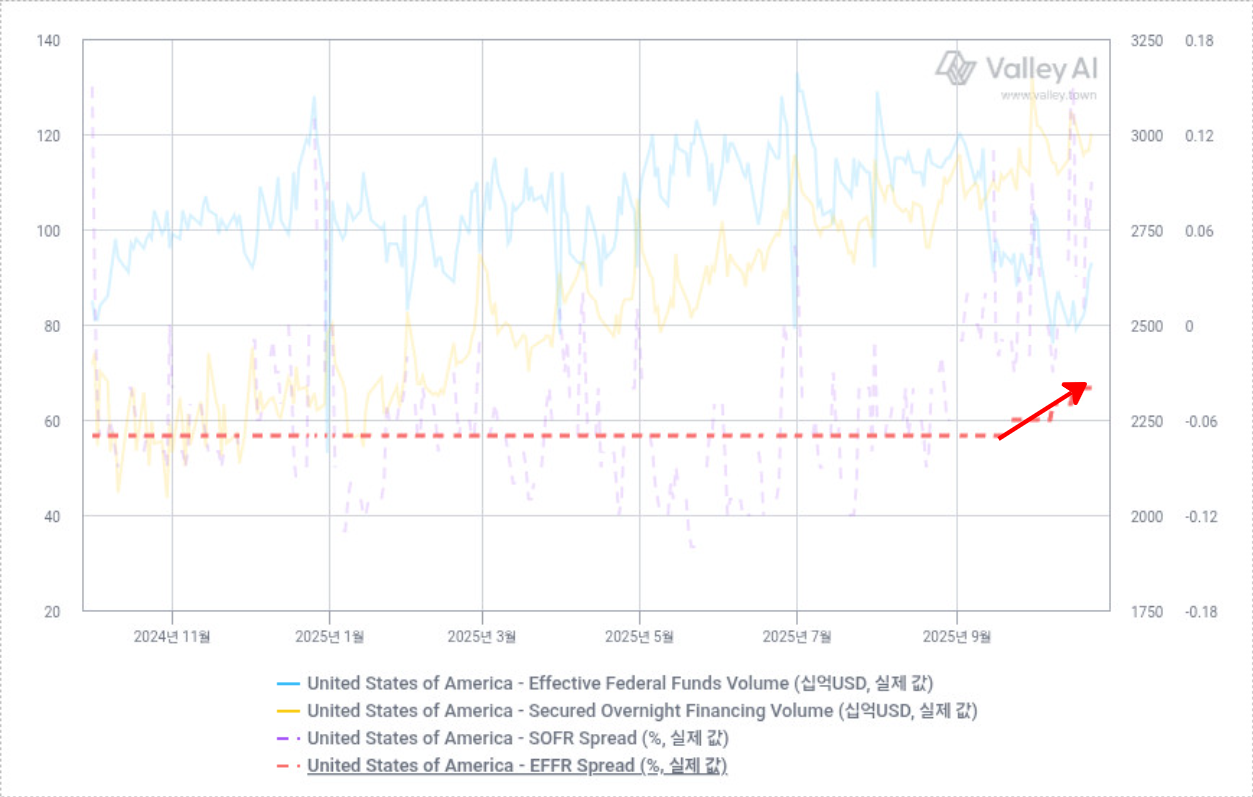
- EFFR (Effective Federal Funds Rate): the actual rate at which banks lend / borrow reserves unsecured in the federal funds market.
- IORB (Interest on Reserve Balances): the "risk-free" return banks earn by depositing at the Fed — their opportunity cost.
A widening EFFR–IORB spread (EFFR 〉〉 IORB) means banks are earning more by lending unsecured at EFFR than by depositing at the Fed (risk-free) at IORB — read as the following stress signals:
- Rising short-term funding demand and reserve scarcity: some banks need reserves so badly they borrow even paying a premium (EFFR) above the safe IORB.
- Inefficient reserve distribution: reserve-rich banks demand a high premium rather than depositing at the Fed, or funds are not flowing efficiently to the banks that need reserves most.
4. The Secured Market
(1) Secured Overnight Financing Volume
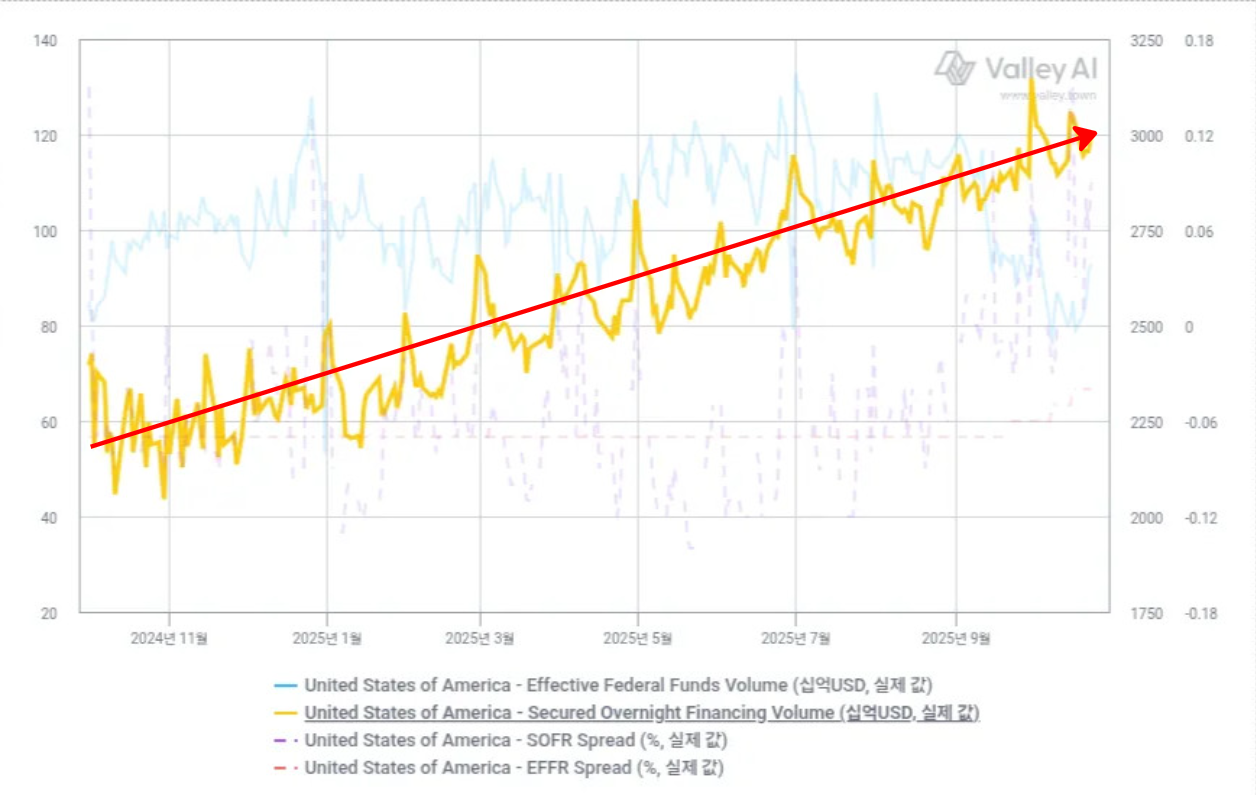
Measures the total dollar size of the repo market collateralized by US Treasuries — a signal on short-term liquidity, funding demand, and trade activity.
- Stable volume: a healthy, liquid repo market.
- Rising volume: rising short-term cash borrowing demand. With QT since 2022 shrinking system reserves, greater repo reliance for cash is the main factor.
- Falling volume: reduced funding activity, or excess liquidity (abundant reserves, or ON RRP use substituting for repo demand).
(2) The SOFR–IORB spread
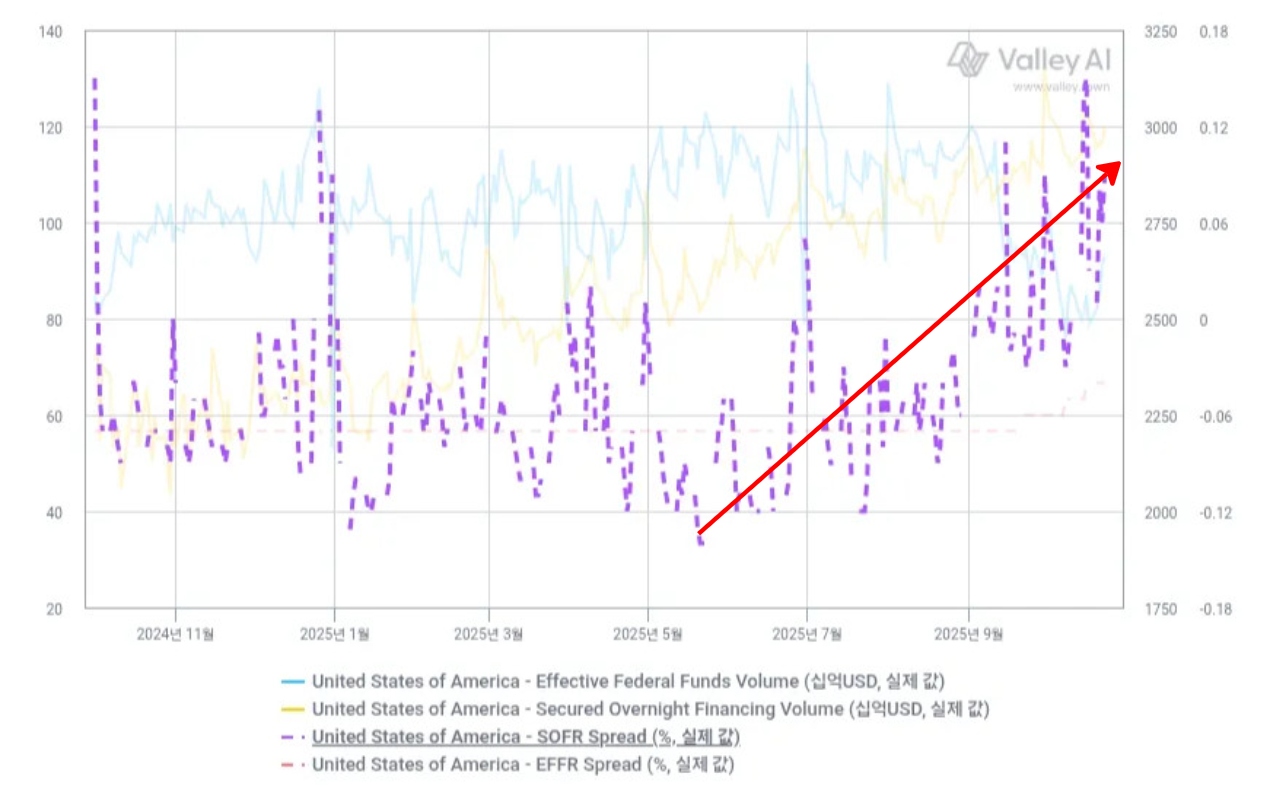
- SOFR (Secured Overnight Financing Rate): the rate to lend / borrow cash in repo against overnight US-Treasury collateral.
- IORB: see above (the Fed-deposit risk-free rate).
A widening SOFR–IORB spread (SOFR 〉〉 IORB) is a situation where even with prime collateral (Treasuries) the overnight lending rate exceeds the risk-free IORB — a far stronger liquidity-pressure signal than a rise in the unsecured EFFR.
- Repo-market liquidity pressure: despite posting Treasuries, short-term cash demand is so strong that a rate above IORB forms — a clear signal that repo demand exceeds supply.
- Rising dealer funding cost: the short-term funding cost of primary dealers (PDs) and other key participants is rising.
5. September–October Synthesis — Signs of Liquidity Stress
In conclusion, signals of an intensifying liquidity-stress trend in the short-term funding market over September–October are clear. Two diagnosed causes:
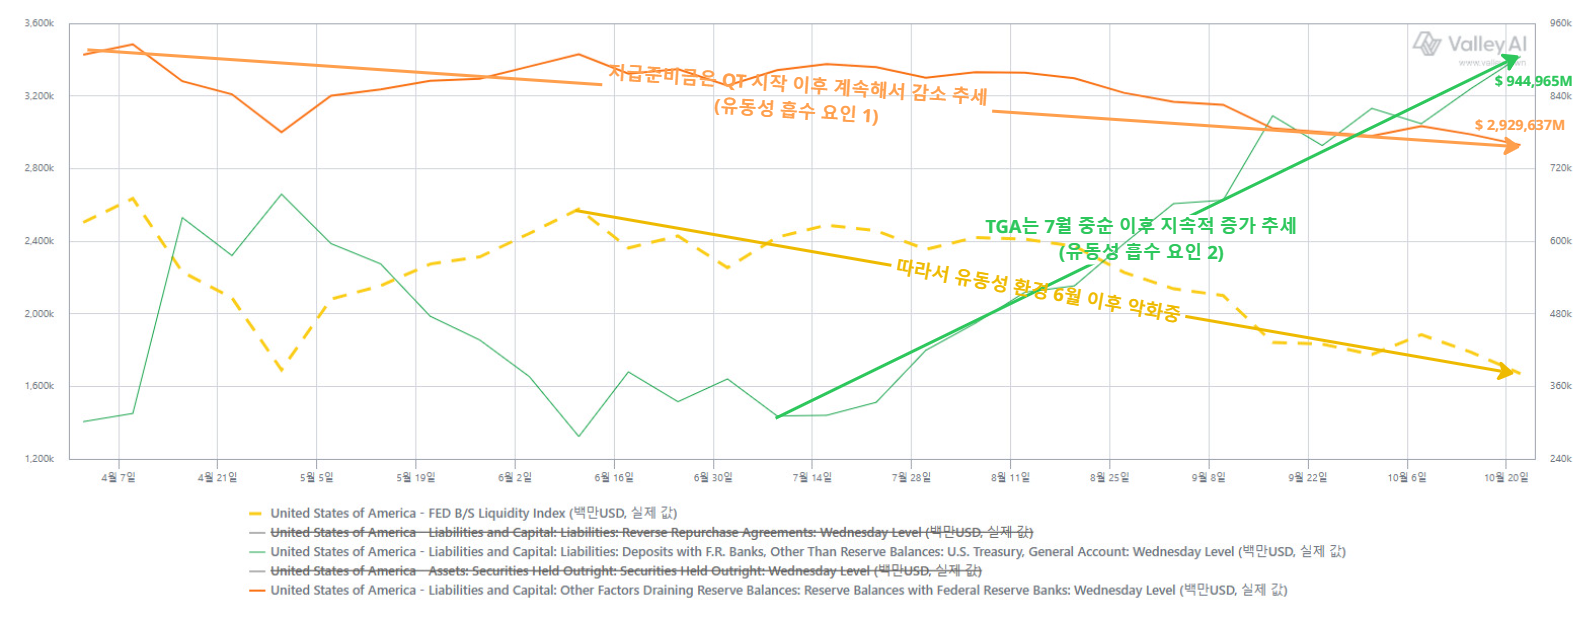
- The cumulative effect of QT: prolonged tightening has driven reserve-decline liquidity pressure toward a critical point.
- The TGA surge: the Treasury's continued TGA build since mid-July absorbed market liquidity heavily short-term.
(1) The final signal — the Standing Repo Facility (SRF)
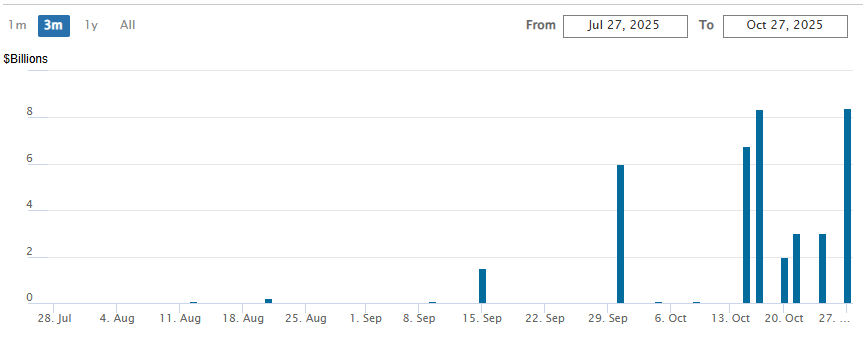
The last indicator to watch is the Standing Repo Facility (SRF). Its core function is a reliable backstop for the short-term funding market — the "lender of last resort" for participants. Small SRF use can read as normal operation, but if private markets fail to function and banks begin relying permanently on the central-bank backstop, that is a clear danger signal. The recent uptrend in SRF usage frequency is why the current liquidity environment must be watched very closely.
(2) The backdrop to the QT pause
"At today's meeting, the Committee also decided to conclude the reduction of our aggregate securities holdings as of December 1. Our long-stated plan has been to stop balance sheet runoff when reserves are somewhat above the level we judge consistent with ample reserve conditions. Signs have clearly emerged that we have reached that standard." — Oct 2025 FOMC
The QT pause was confirmed for December 1. The liquidity-stress signs above were the core backdrop to the decision.
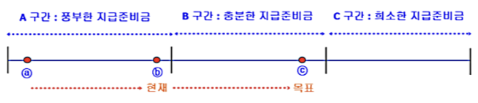
The Fed also officially acknowledged reserves had moved from the "abundant" stage to "slightly above the 'ample' stage," its target. The market transmission from this juncture is taken up next in 4Q25 Review Part 1.