4Q25 Review Pt. 1 | From Liquidity Fissures to Risk-Off

The chain mechanism behind the Q4 market correction.
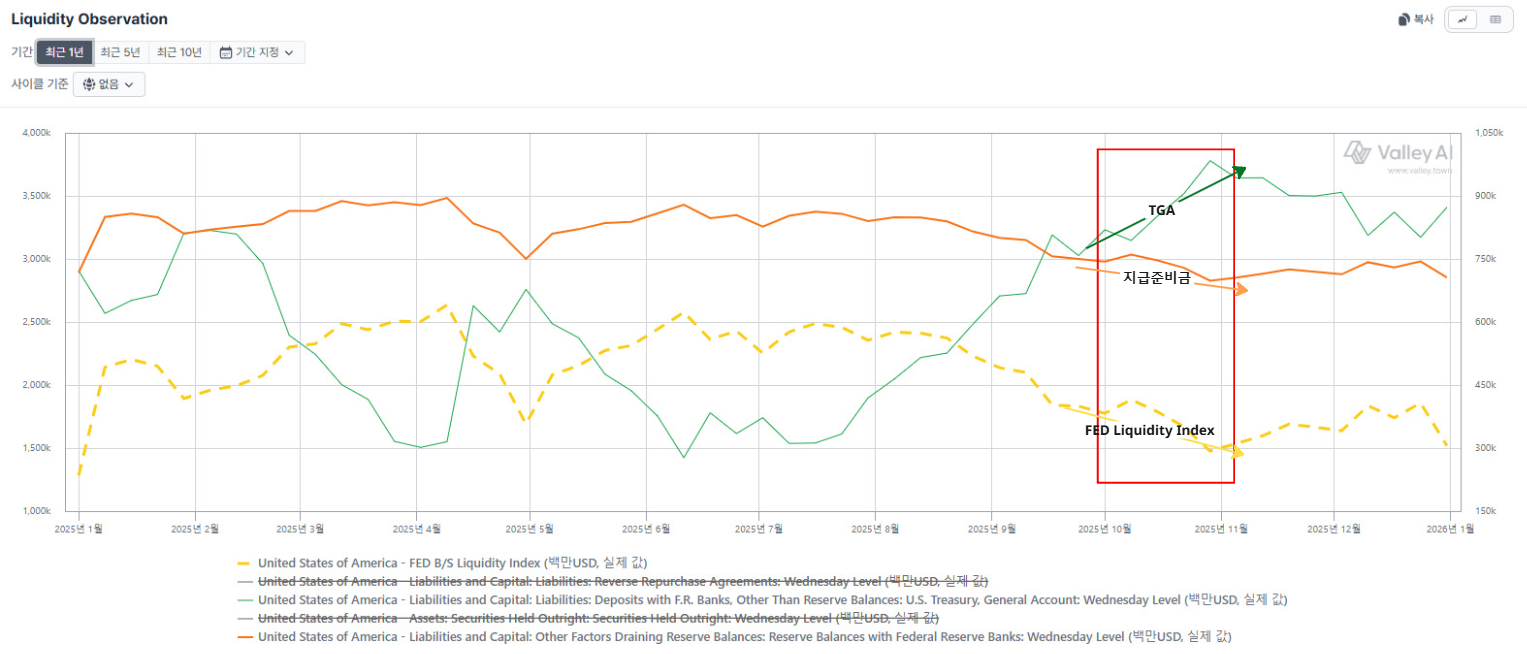
1. Structural Backdrop — Sustained Q3 TGA Absorption, ONRRP Depletion, then Continued QT Eroding the Reserve Buffer
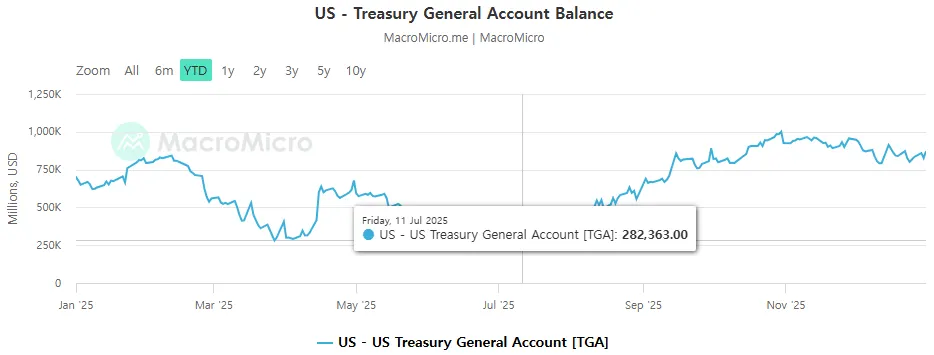
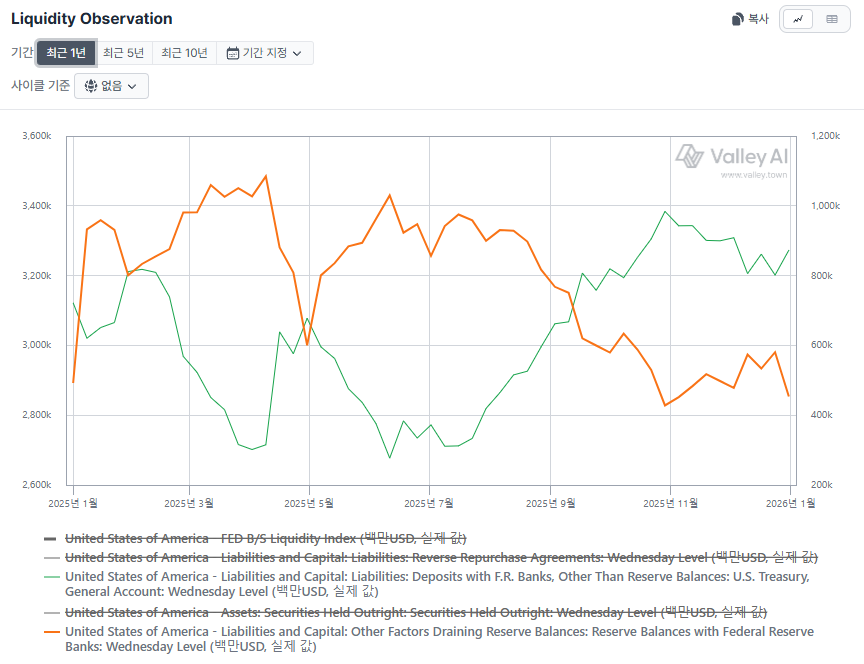
After the TGA balance bottomed in July / November, system liquidity was absorbed into the TGA through Q3. The market should normally have corrected on the after-effects, but it held up on (1) reserves that were at a relatively adequate level at the time, and (2) substantial optimism toward the AI industry.
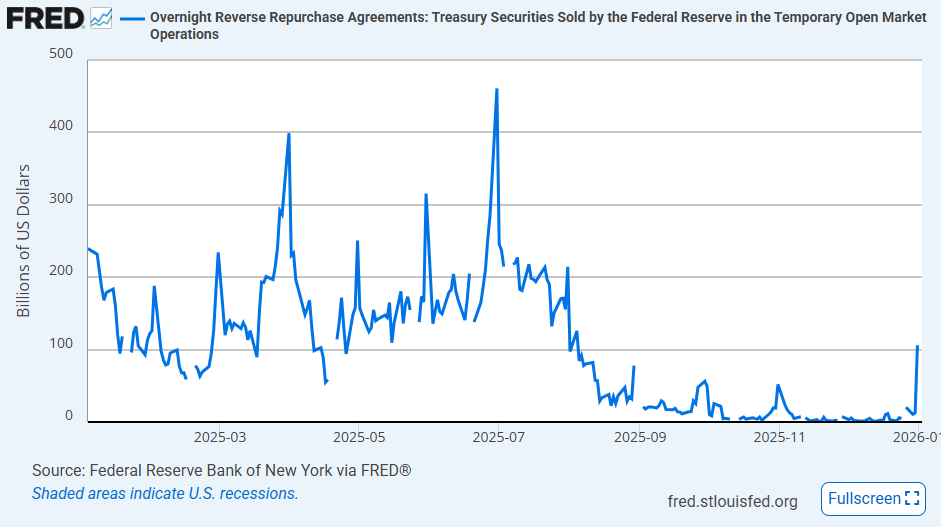
ONRRP also converged toward zero entering Q3 — it had been the source of TGA liquidity through end-September.
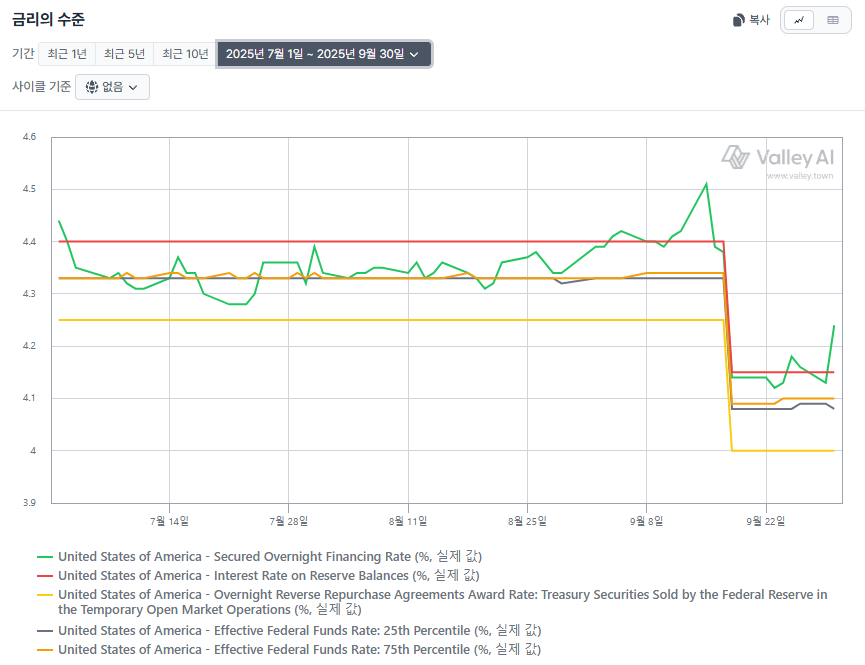
Through early September money-market liquidity was largely fine — SOFR moved within a stable range. But from early September liquidity sensitivity began to rise, and SOFR moved well above IORB.
2. The Absorption Persists
(1) The October shutdown made TGA outlays impossible
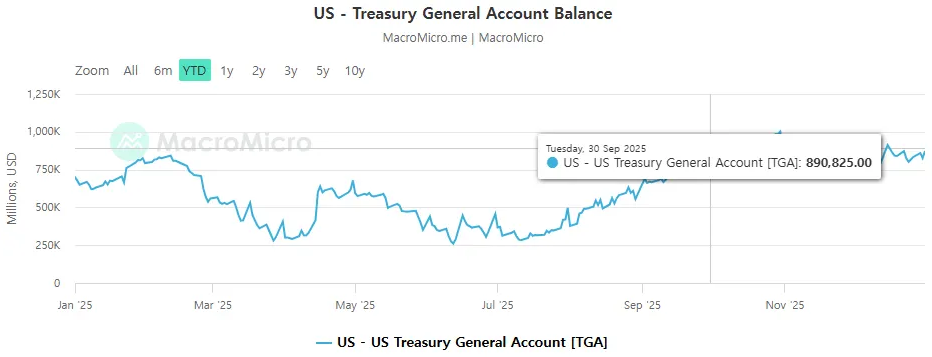
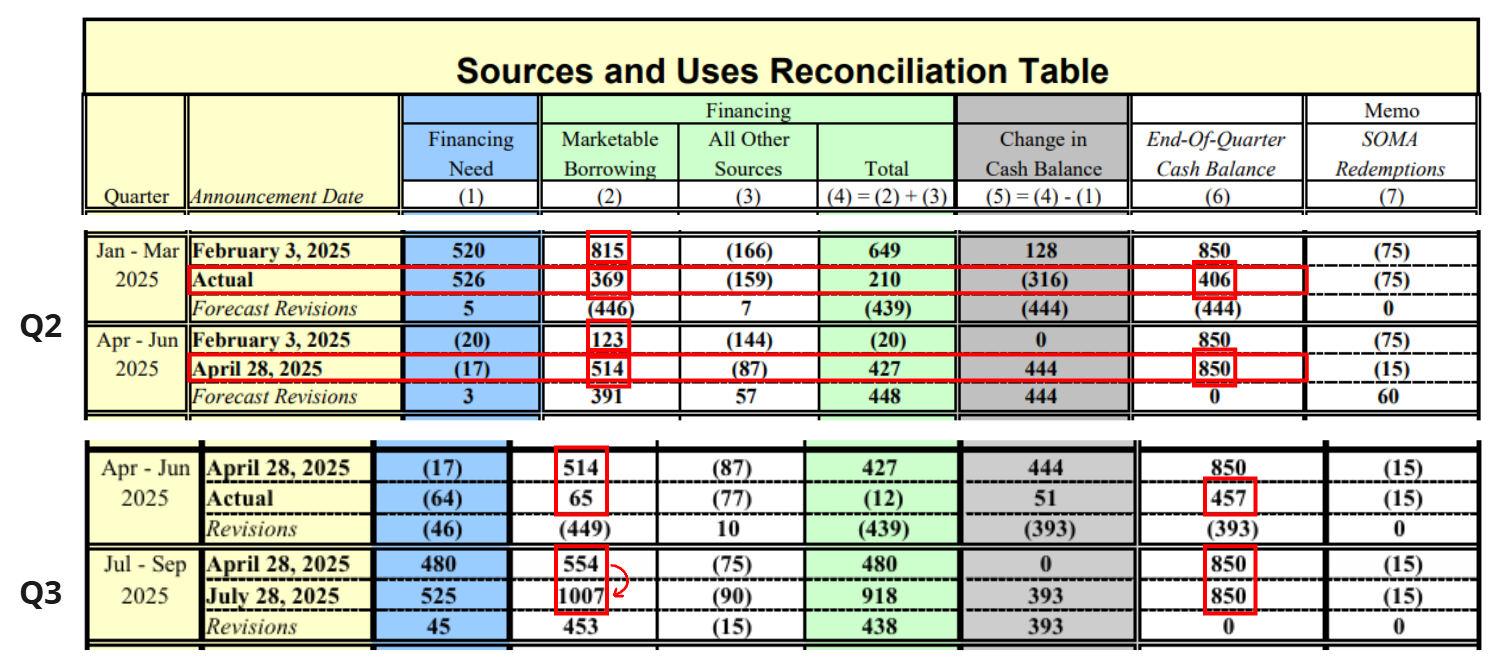
- The US government entered a shutdown on October 1. The end-Q3 TGA balance of ~$890B exceeded the $850B target, so outlays were due — but the prolonged shutdown meant only absorption continued. A shutdown halts the liquidity flow from the fiscal side to the private sector, while tax collection etc. continues, so the absorption from private to government persists.
- Spare cash like ONRRP could only cover the TGA's absorption through end-September.
(2) Aggressive Hyperscaler / Neocloud borrowing absorbing into the credit channel
(Chart below generated from data.csv — the raw dataset is kept with the Korean source project.)
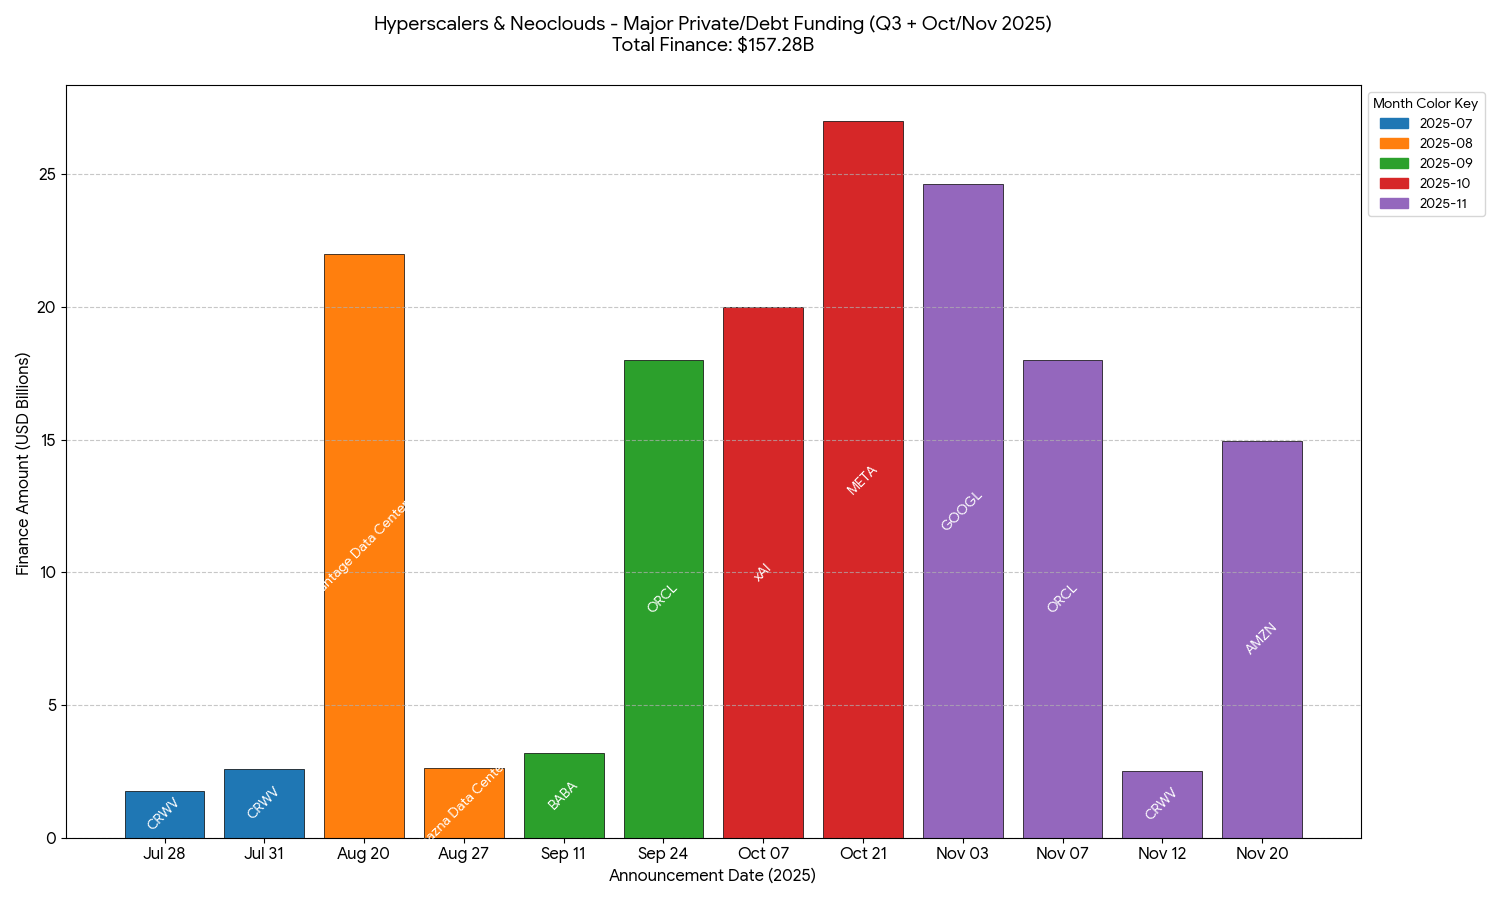
- Hyperscalers / Neoclouds began adding debt and private financing to their previously cash-based CAPEX funding. Available market cash was absorbed into the credit channel.
- Even just the funding activity of the major AI cloud-infrastructure firms — not large relative to the TGA absorption, but timed when money-market liquidity had turned sensitive — absorbed an additional ~$157.28B + α.
- In particular, funding by majors like $ORCL · $META · $GOOGL · $AMZN concentrated in early Q4.
3. The Trigger — October 10 Tariffs
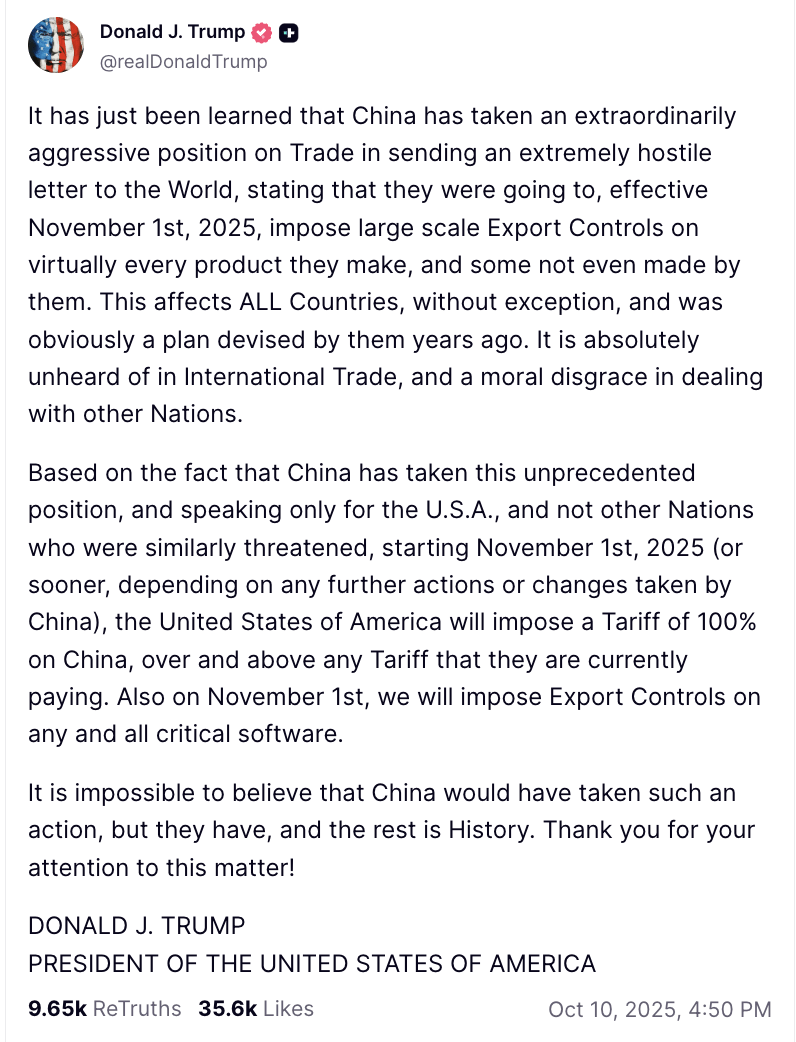
Oct 10, 2025 — Trump's remark on a 100% tariff on China
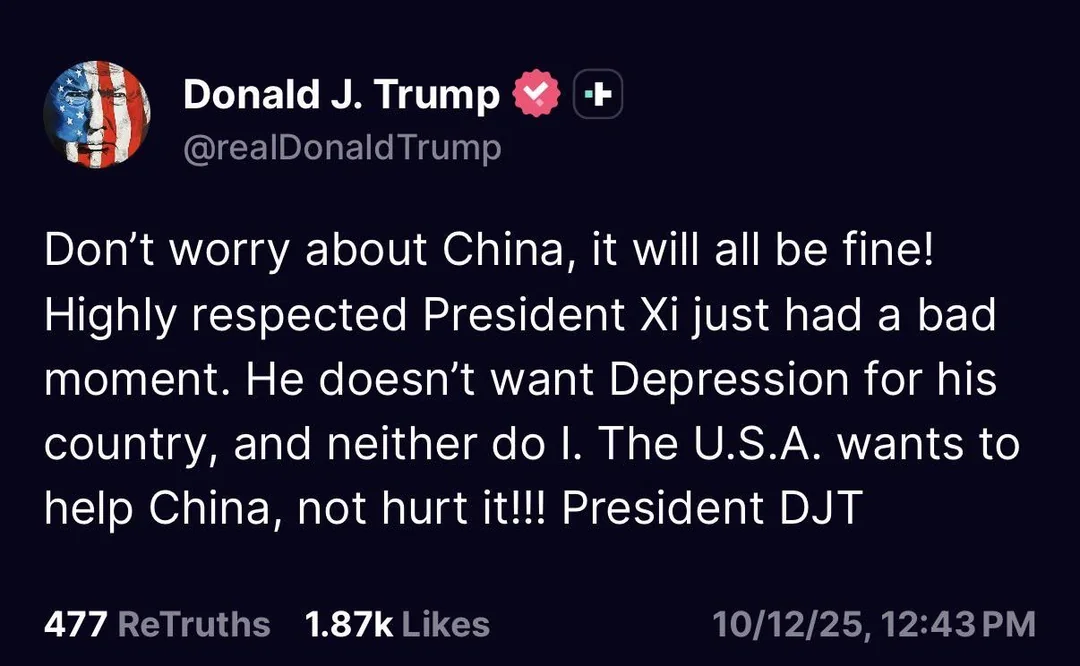
Oct 12, 2025 — Trump's softening of the China-tariff remark
- On October 10, 2025, in response to China's rare-earth export controls, President Trump announced an additional 100% tariff on all Chinese imports as of November 1, on top of the existing 30%.
- Immediately after, the crypto market — most sensitive to liquidity — took the biggest hit: over $19B of leveraged positions were force-liquidated within 24–36 hours, the largest single-day forced liquidation on record per CoinGlass data.
- Apparently shocked by the sudden volatility, he substantially softened the China-tariff tone over the Oct 11–12 weekend. The market judged there was no intent to actually impose the extra 100% and recovered some of the Oct 10 damage, but only the surface pretext disappeared — the systemic liquidity fissure was not fully repaired.
4. Money-Market Warning Light — SOFR Persistently Above IORB, Failing to Return to the Lower Channel
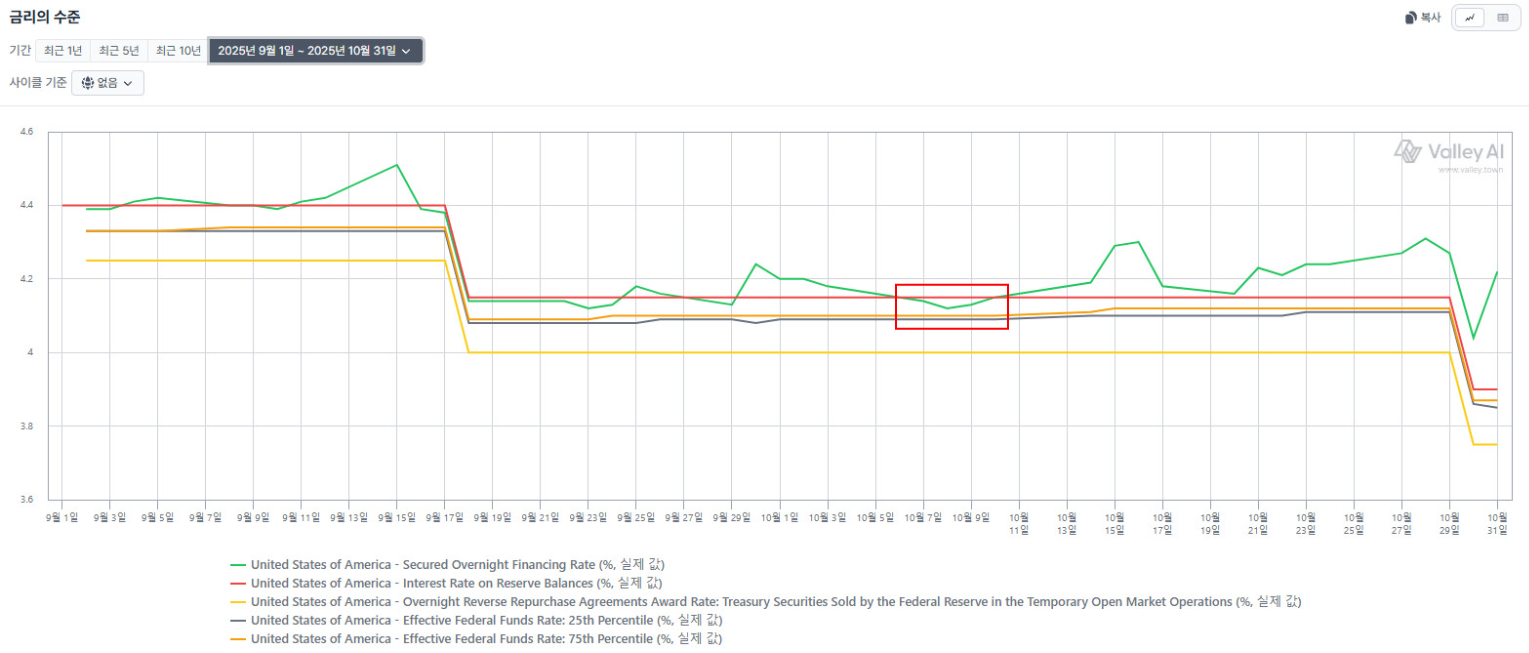
- From early September, money-market liquidity sensitivity rose. With the remaining ONRRP balance barely buffering the TGA absorption through Q3, ONRRP approaching zero in early September is the presumed signal of emerging liquidity shortage.
- After the December 2024 cut to 4.5% and a hold through early September 2025, a 25bp cut briefly stabilized the liquidity environment, but upward pressure remained strong and SOFR kept printing above IORB. Just as SOFR was about to settle back below IORB, Trump's October 10 China-tariff threat re-elevated volatility and SOFR stabilization failed.
5. Rising Reliance on Fed Backstops Like the SRF
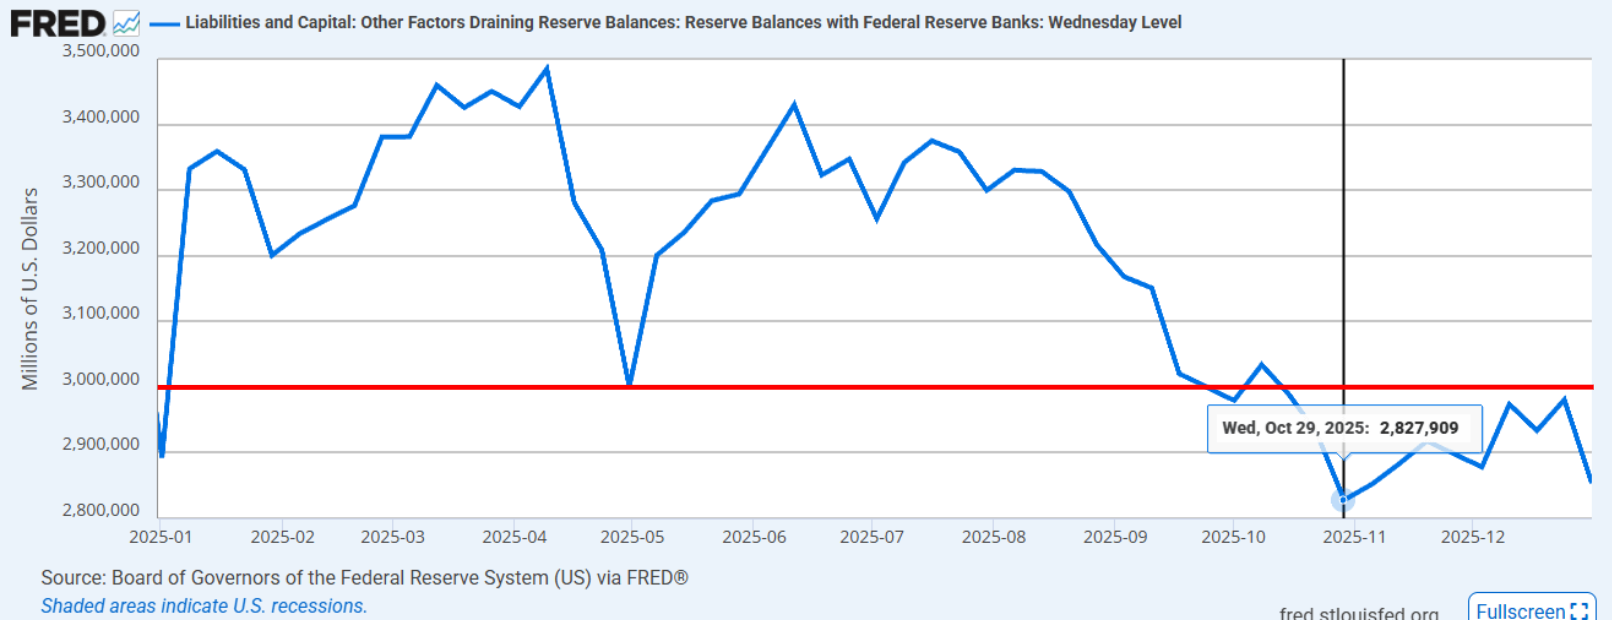
2025 Fed reserve balances (Reserve Balances with Federal Reserve Banks); the red line is the $3,000B level
Meanwhile the TGA, with the shutdown dragging on, kept absorbing instead of spending. Reserves continued to fall, hitting a year low in October, with the balance dropping from the $3,000B handle to a 2-handle, ~$2,800B.
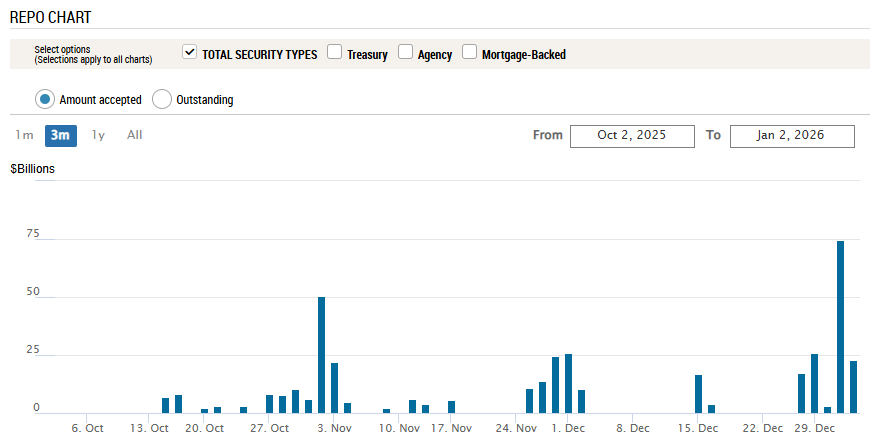
SRF usage after October 10, 2025
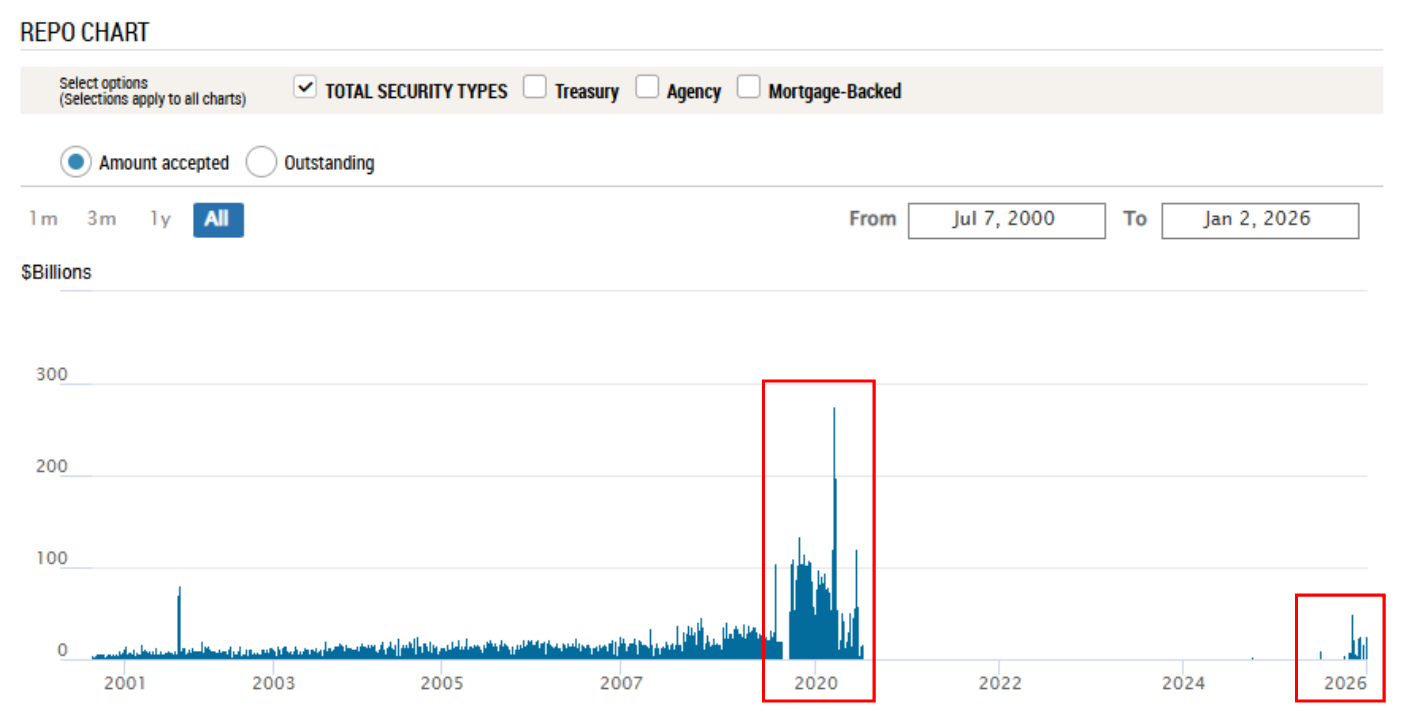
SRF borrowing now vs the 2020 COVID period
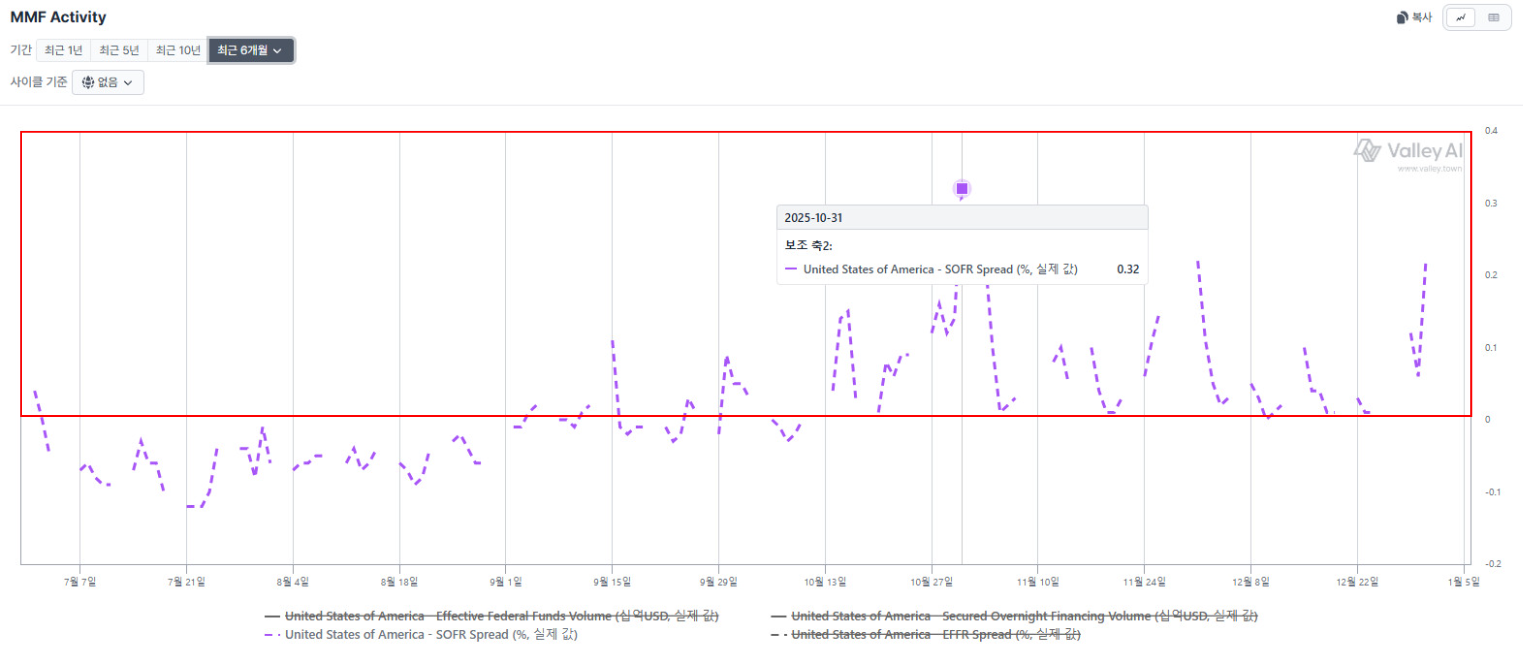
SOFR–IORB spread; the red box is the range above 0bp
- From October 15, when the reserve handle first dropped, borrowing began at the SRF window. It then increased progressively — a signal of a serious fissure in the money-market liquidity environment, where short-term liquidity supply could not keep up with demand. Over this period SOFR ran up to 32bp above IORB at the widest.
- To objectify the severity of October, comparing the historical SRF borrowing scale helps. 2025 SRF usage is considerably smaller than the 2020 COVID period, implying the liquidity problem is only short-term in severity. Yet given it had not been used at all since 2020, it shows institutions in the current environment are under significant funding stress.
- The Fed, reading the above liquidity-stress signs, announced an end to QT effective December 1.
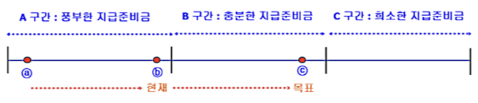
- It also officially acknowledged reserves had moved from the "abundant" stage to "slightly above the 'ample' stage," the Fed's target. On the Fed's criteria this range is expected to be somewhere between $2,800B–$2,900B.
6. After the Credit Narrative Coupled In, the Debt-Based AI-Bubble Framing Strengthened
- Around the same window, events occurred in the private-credit market: the bankruptcies of subprime auto seller/lender Tricolor Holdings (Sep 10) and auto-parts supplier First Brands Group (Sep 28). After each failure, the regional banks that had supplied loans booked the related losses. Improper funding methods — double-pledged collateral, document falsification, opaque balance sheets — surfaced, raising concern about bad loans in the private-credit market that had approved them.
- After these events, as Howard Marks's memo noted — "the worst loans are made in the best of times" — the view on private credit turned negative.
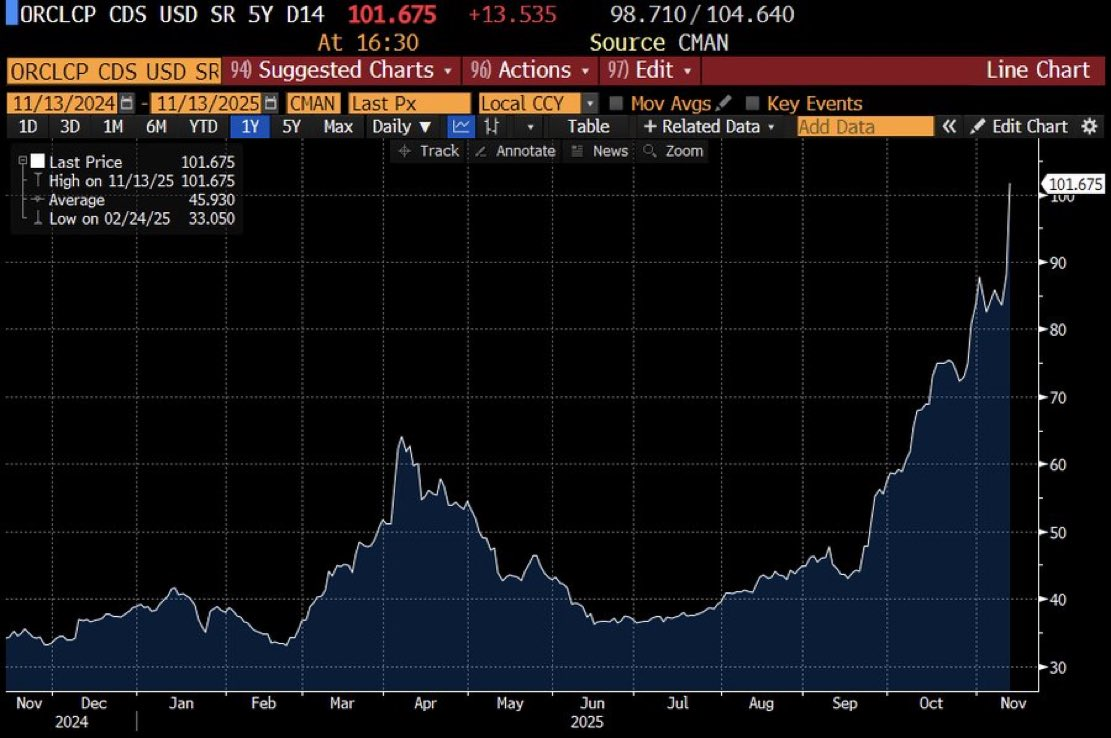
- At the same timing, as bond-based funding in the private-credit market grew, led by $ORCL · $META and others, a debt-rollover-risk and corporate-bankruptcy-possibility frame attached. $ORCL's record CDS pricing attests to this. The further spike in $ORCL CDS through November connects to event (7) below.
7. The Full Emergence of the AI-Bubble Thesis
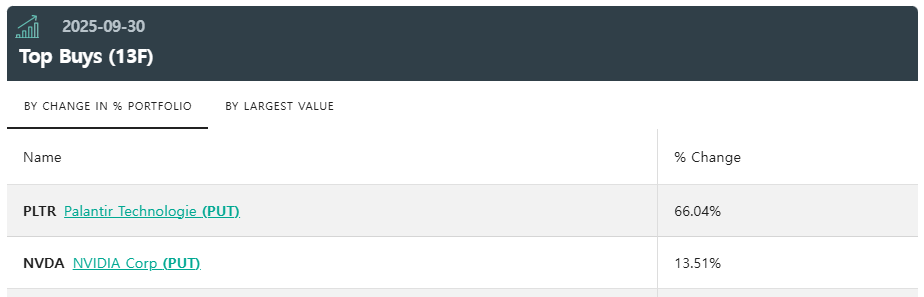

- On October 31, with a sudden AI-bubble pre-announcement, the Q3 portfolio of Michael Burry's fund Scion Asset Management was disclosed via 13F on November 3. 66% was $PLTR puts and 13.5% $NVDA puts — read as a position betting on a valuation correction across AI software and hardware broadly, i.e. the entire AI ecosystem anchored on $PLTR and $NVDA. It was taken not as single-name risk but as a structural caution signal on the whole AI CAPEX cycle.
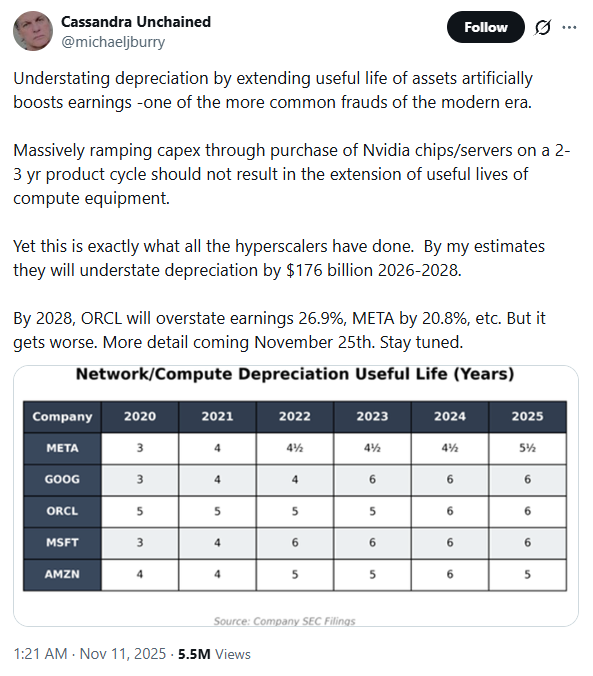
- Simultaneously, the market re-examined that major hyperscalers and neoclouds are setting NVIDIA-GPU depreciation periods more aggressively than before. Short-term this eases accounting cost burden and expands CAPEX headroom, but conversely it embeds uncertainty about GPU technical-obsolescence speed and the revenue-generation horizon. That is, concern began to surface that the payback timing of AI infrastructure investment could be delayed, or the timing mismatch between expected profitability and actual cash flow could widen.
- With this positioning disclosure and the questions on CAPEX-payback structure acting as triggers, over November the equity market entered a broad risk-off and valuation-adjustment phase centered on AI names. This is read less as a transient event-driven correction than as the first interval where the timing risk of the AI investment cycle was materially priced in.
8. Putting the Liquidity-Shock Chain Reaction Together
The target of a liquidity shock starts with the sectors most sensitive to leverage and funding. The Q4 2025 correction was not a single event but a chain reaction transmitted money-market → credit channel → high-beta assets → equities.
- TGA absorption, ONRRP depletion, and continued QT overlapped, weakening the reserve buffer, and structural tension accumulated in the money market with SOFR running above IORB. Then the government shutdown blocked TGA outlays and sustained the private-side absorption.
- Aggressive debt / private-credit funding by hyperscalers / neoclouds occurred at a moment that had turned short-term sensitive, absorbing available cash further into the credit channel. Given the nature of private equity — unlike public equities where market makers are involved — the liquidity buffer is not abundant. Moreover, since most current participants in those private-credit loans are there on a long-term horizon, liquidity once committed is hard to pull back out into public markets — amplifying funding stress further.
- The decisive trigger was Trump's October 10 tariff remark. The sharp volatility expansion caused mass forced liquidations in the highly leveraged crypto market, making the system-wide liquidity fissure visible. The subsequent SOFR instability and the start of SRF usage clearly showed rising reliance on Fed backstops.
- Finally, on this environment, AI CAPEX and the credit narrative coupled. Scion's 13F position, disclosed with the late-October AI-bubble warning, imprinted on the market the possibility of a valuation correction across the AI ecosystem anchored on $PLTR · $NVDA. The GPU-depreciation-period controversy highlighted AI-investment payback timing risk, and in November equities entered a full risk-off centered on AI assets.
In sum, this correction was a textbook systematic transmission of a liquidity shock: weakened liquidity buffer → credit absorption → volatility event → AI-narrative reframing.
Adding the international lens: there was the BOJ's 25bp hike announced December 19, 2025 (0.5% → 0.75% effective December 22), but as the information had been public roughly a month before the announcement, it is inferred to have shown up as a slow, gradual reduction of yen-based leverage funding rather than a direct shock on the scale of August 2024.
| Hike announcement date | Policy-rate change |
|---|---|
| Jul 31, 2024 | 0–0.1% → 0.25% |
| Jan 24, 2025 | 0.25% → 0.50% |
| Dec 19, 2025 | 0.50% → 0.75% |
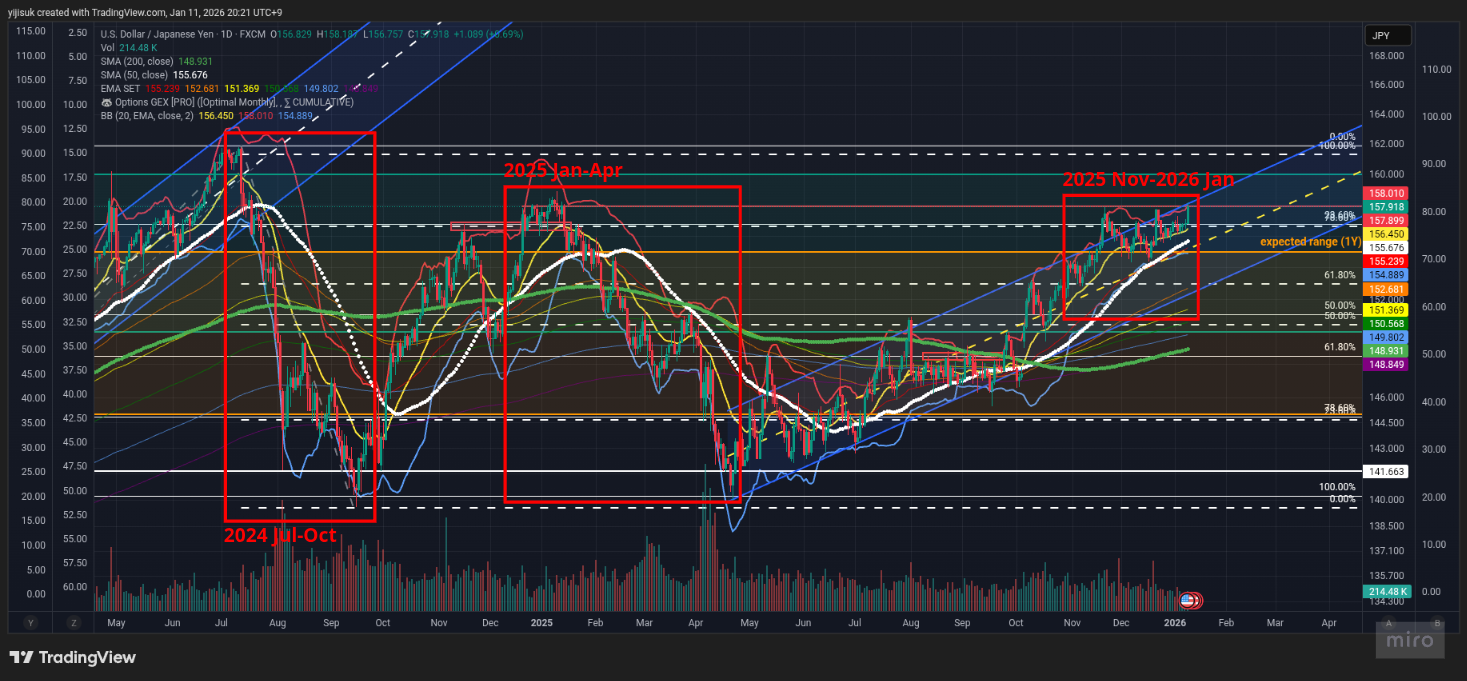
Contrary to expectations, despite the BOJ's additional 25bp hike, USDJPY is on a strengthening trend. The prior two 25bp hikes produced relative USD weakness / JPY strength, but the current reaction contrasts with the past. The December hike, already pre-priced, is judged to have relatively dampened the acceleration of leverage unwinding. The path of USDJPY and yen-carry funding is covered in detail in Part 3.