4Q25 Review Pt. 2 | US Q3 GDP Review

A quarter where the growth print was high, but the composition of the growth drivers and the measurement uncertainty have to be read separately.
4Q25 Review
- Part 1⎯From Liquidity Fissures to Risk-Off
- Part 2⎯US Q3 GDP Review
- Part 3⎯A Short-to-Medium-Term Liquidity Scenario Centered on USDJPY
1. The Key Figures
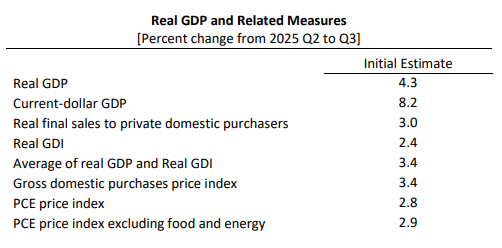
| Metric | QoQ growth |
|---|---|
| Real GDP | +4.3% |
| Real GDI | +2.4% |
| Real final sales to private domestic purchasers | +3.0% |
| PCE Price Index | +2.8% |
| Core PCE | +2.9% |
First conclusion: real (headline) GDP is strong, but read alongside the gap to the income side (GDI, ≈1.9pp) and the private domestic demand metric (3.0%), there is ample room to step the read-through on growth strength down a notch.
2. The Quality of the Drivers, by Contribution
(1) Personal Consumption Expenditures
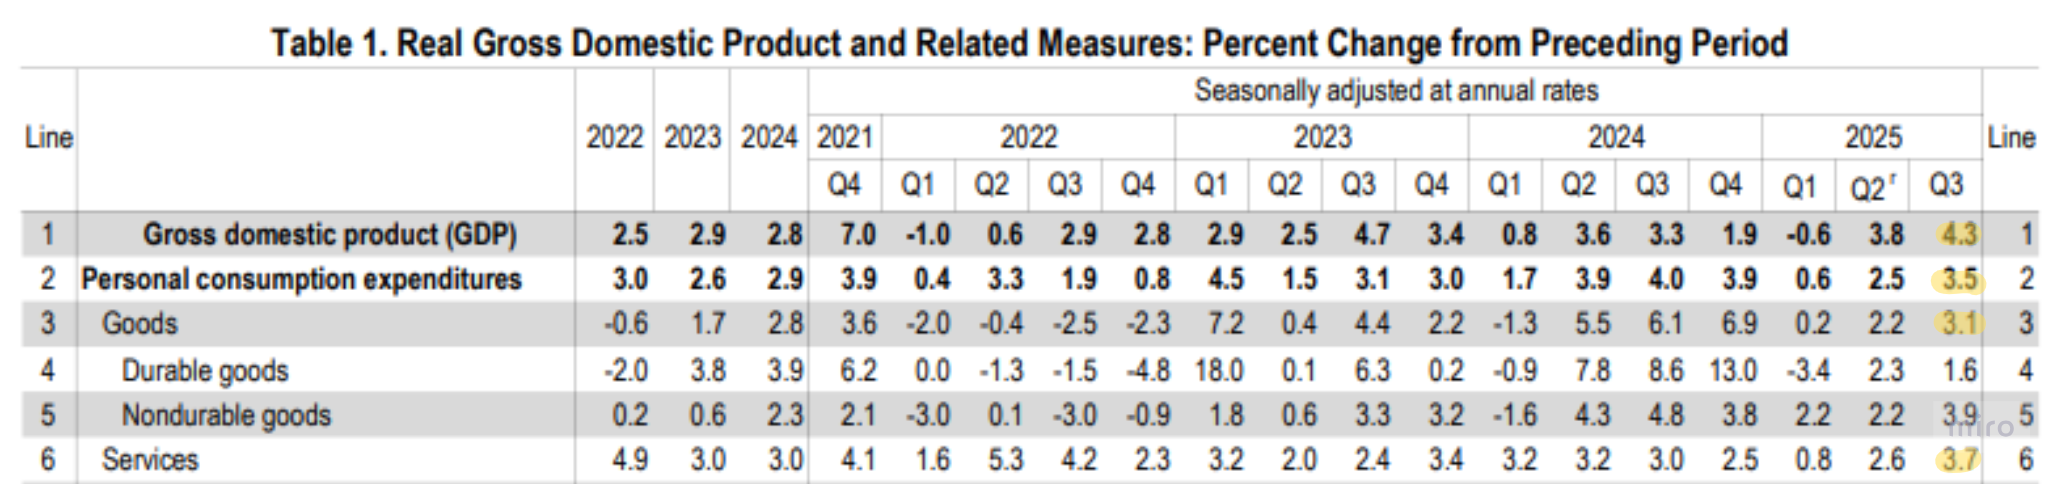
QoQ PCE growth of +3.5%:
- Goods +3.1%
- Services +3.7%
The highest growth print of 2025.
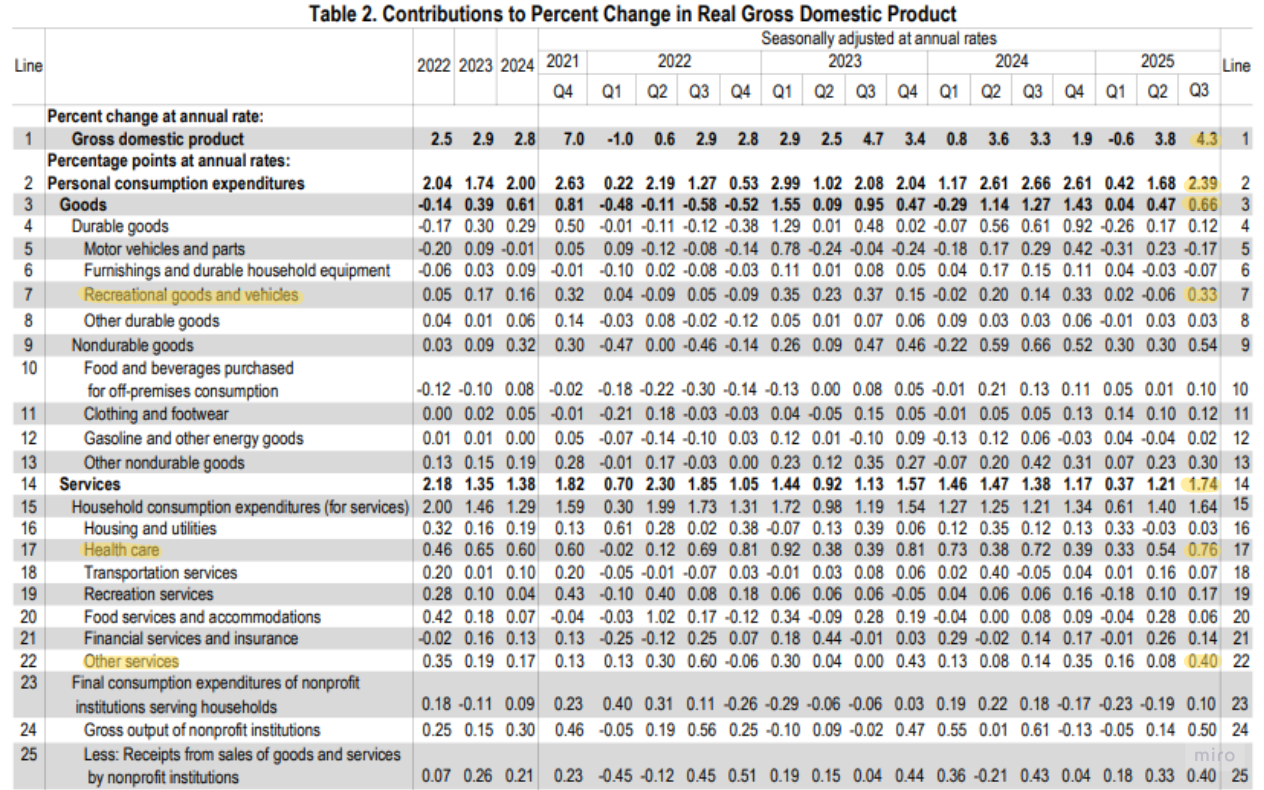
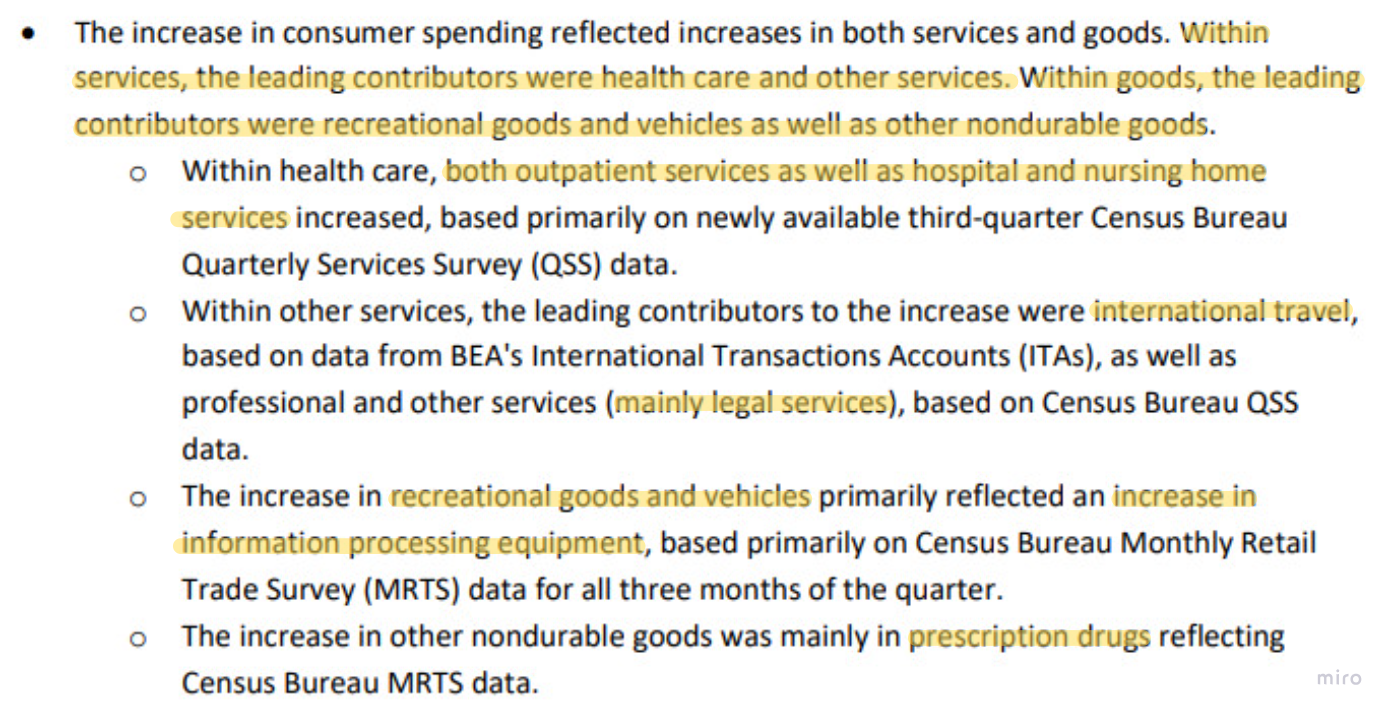
Of PCE's +2.39pp GDP contribution, the named leading contributors:
- Goods — recreation (incl. vehicles) +0.33pp, centered on IT-type goods spanning PCs / phones and related software and accessories.
- Services — healthcare +0.76pp (centered on outpatient and nursing care), other services +0.40pp (centered on overseas travel and professional legal services).
Read-through:
- Not so much "solid" consumption as consumption pulled up by services (healthcare / travel) and specific high-ticket, durable, IT-type goods — a structural feature.
- It implies a "K-shaped consumption divergence." Upper-income cohorts enjoying the wealth effect of rising asset prices can sustain premium-service and leisure-durable spending despite price pressure, whereas lower-income cohorts face budget constraints that slow or trim consumption.
(2) Investment
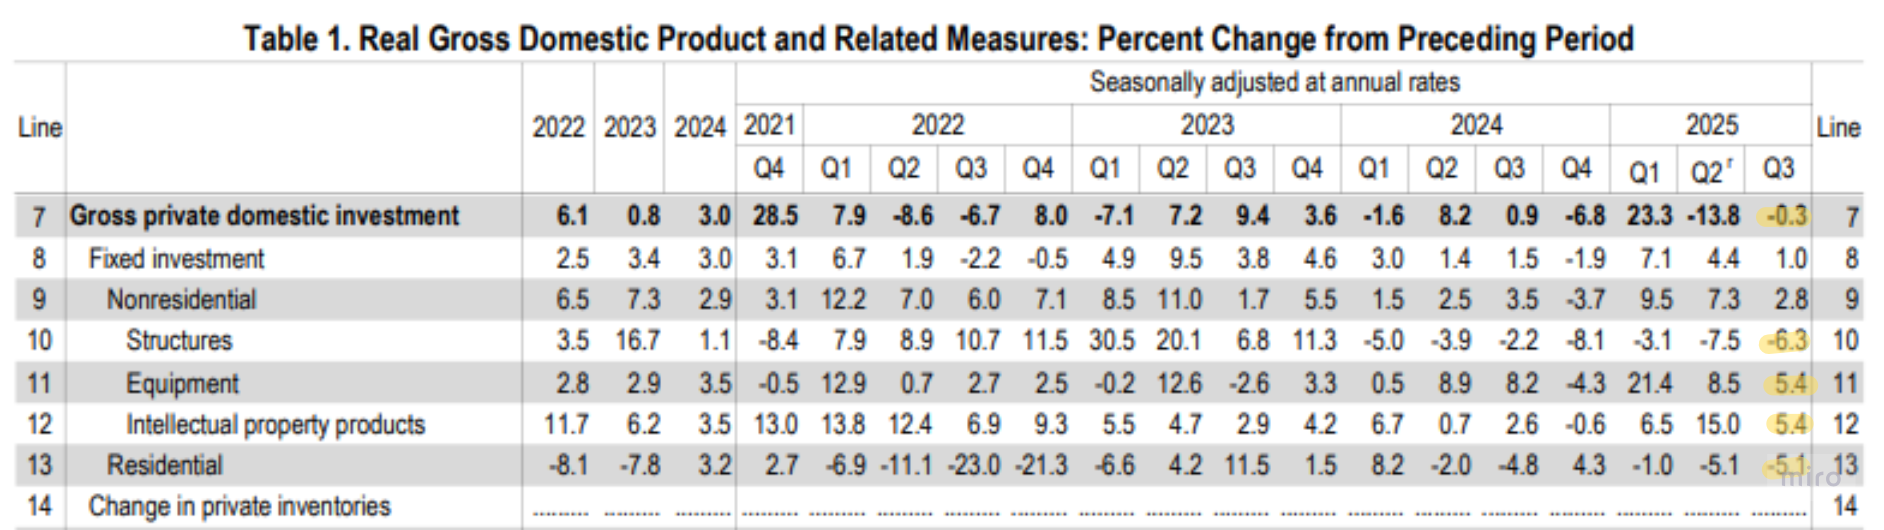
QoQ Gross Private Domestic Investment growth of −0.3%, but the composition splits:
- Equipment +5.4%
- Intellectual property products +5.4%
- Structures (nonresidential) −6.3%
- Residential −5.1%
Equipment and IP investment — likely tied to AI / data-center spend — printed positive, while rate-sensitive housing and structures dragged total investment growth: the textbook high-rate-regime pattern.
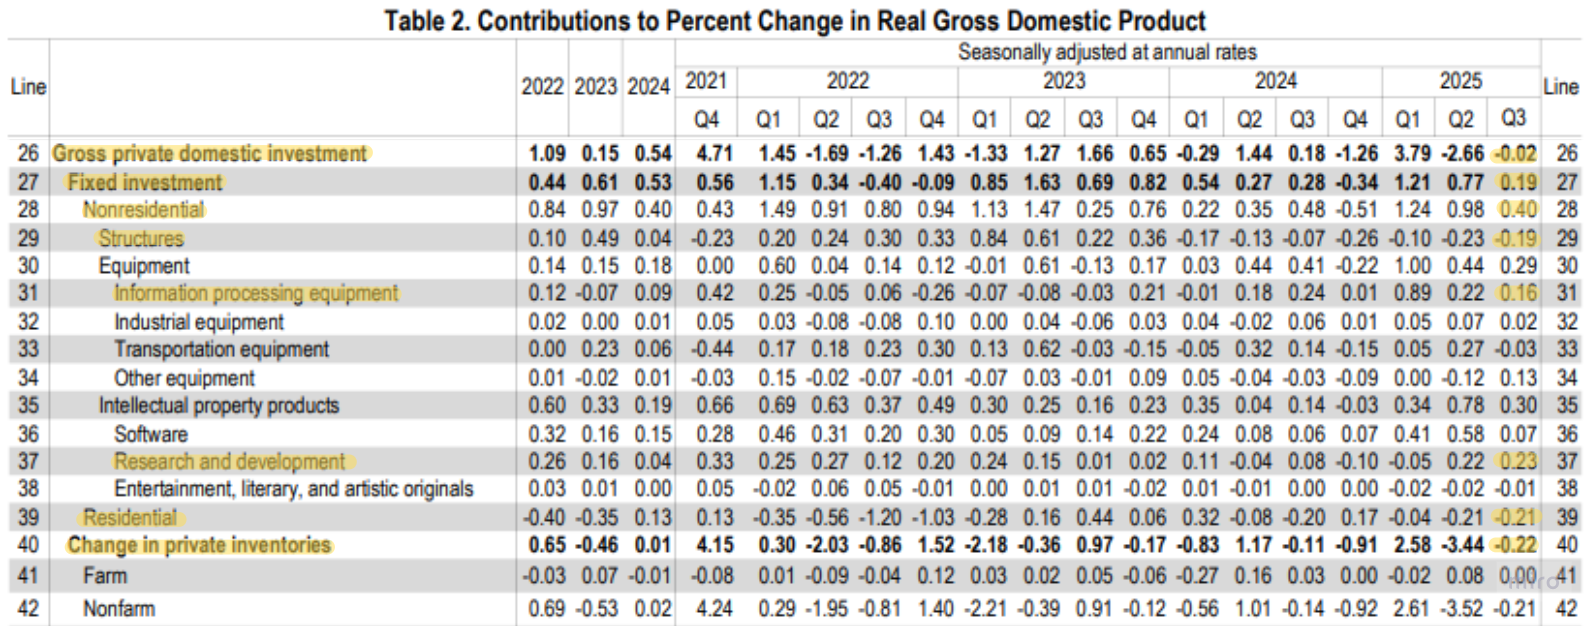
The contribution side shows the same pattern:
- Nonresidential investment +0.40pp, of which nonresidential structures −0.19pp, information processing equipment +0.16pp, R&D spend +0.23pp (the largest R&D contribution since Q2 2022).
- Residential investment contribution −0.21pp.
That is, rather than a broadening base, investment momentum is likely concentrated in capital-intensive sectors.
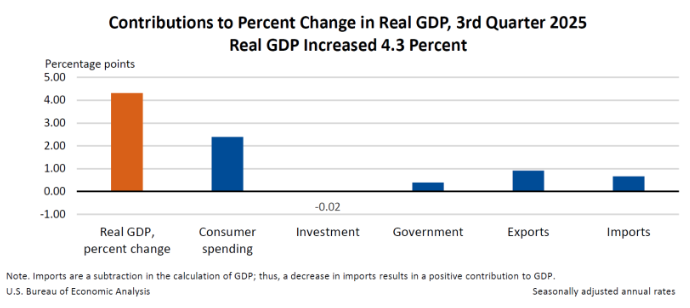
(3) Net Exports
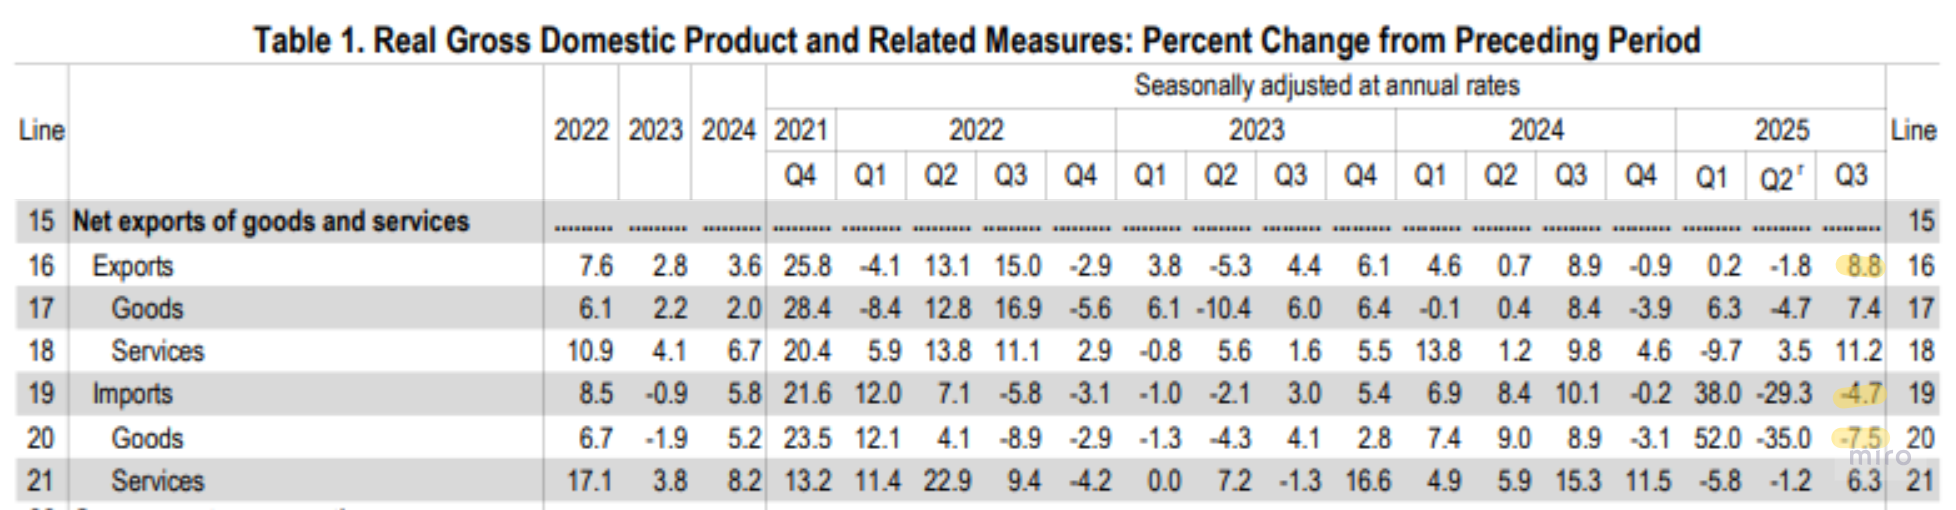
QoQ exports +8.8%, imports −4.7%.
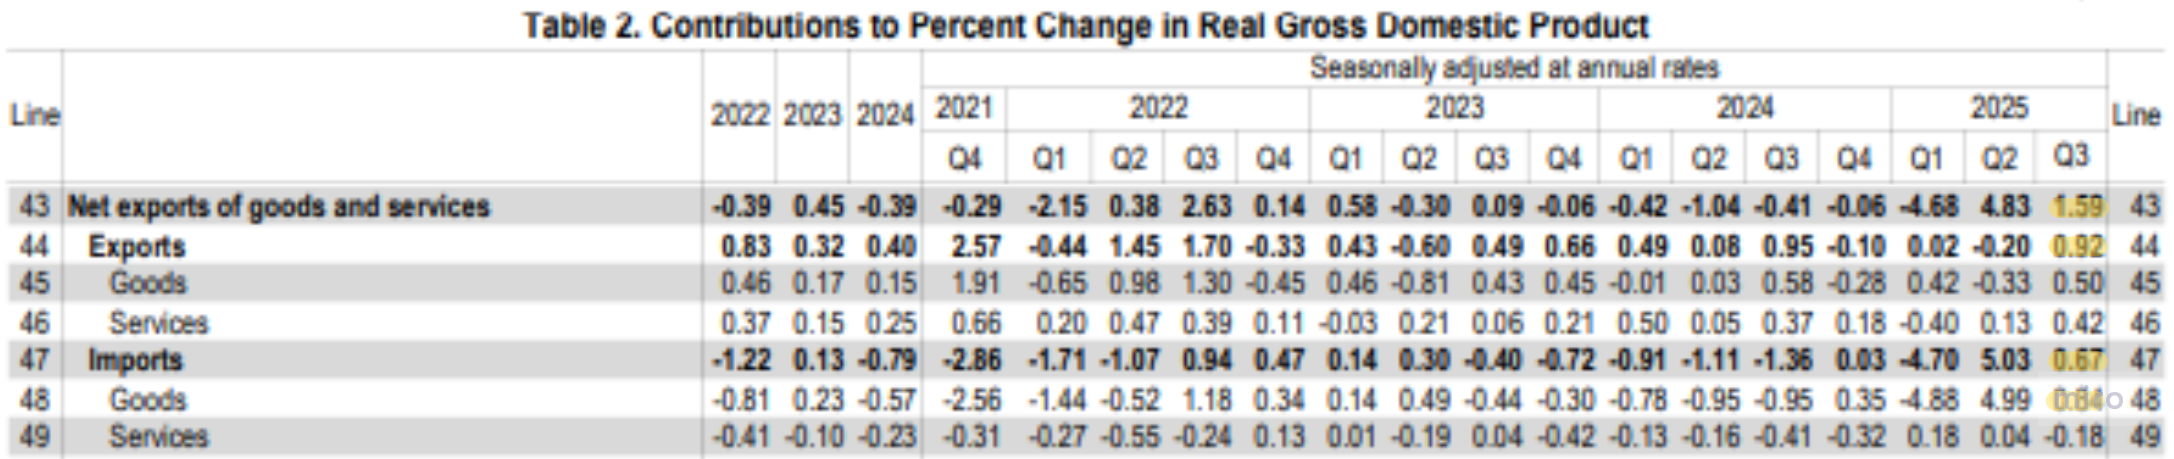
Of the +1.59pp GDP contribution, export growth +0.92pp and the import decline +0.67pp.
Read-through:
- Imports are a subtraction term in the GDP identity, so falling imports mechanically raise GDP.
- The export increase is driven mainly by dollar weakness.
- The import decline signals some softening of domestic demand, and also carries a technical-correction character — front-loading into Q1 ahead of the H1 2025 pre-announced tariffs, followed by payback.
(4) Government Consumption Expenditures and Gross Investment
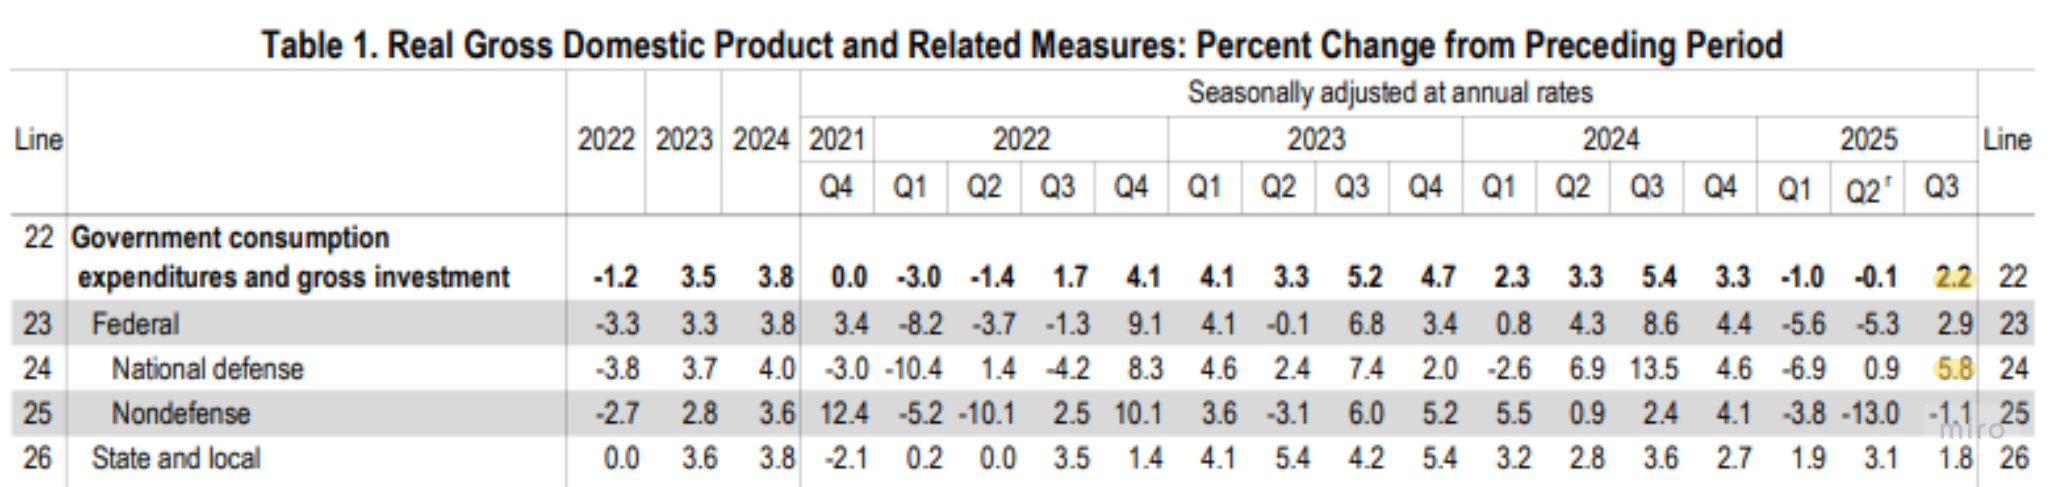
- QoQ government spending +2.2%, of which defense +5.8%.
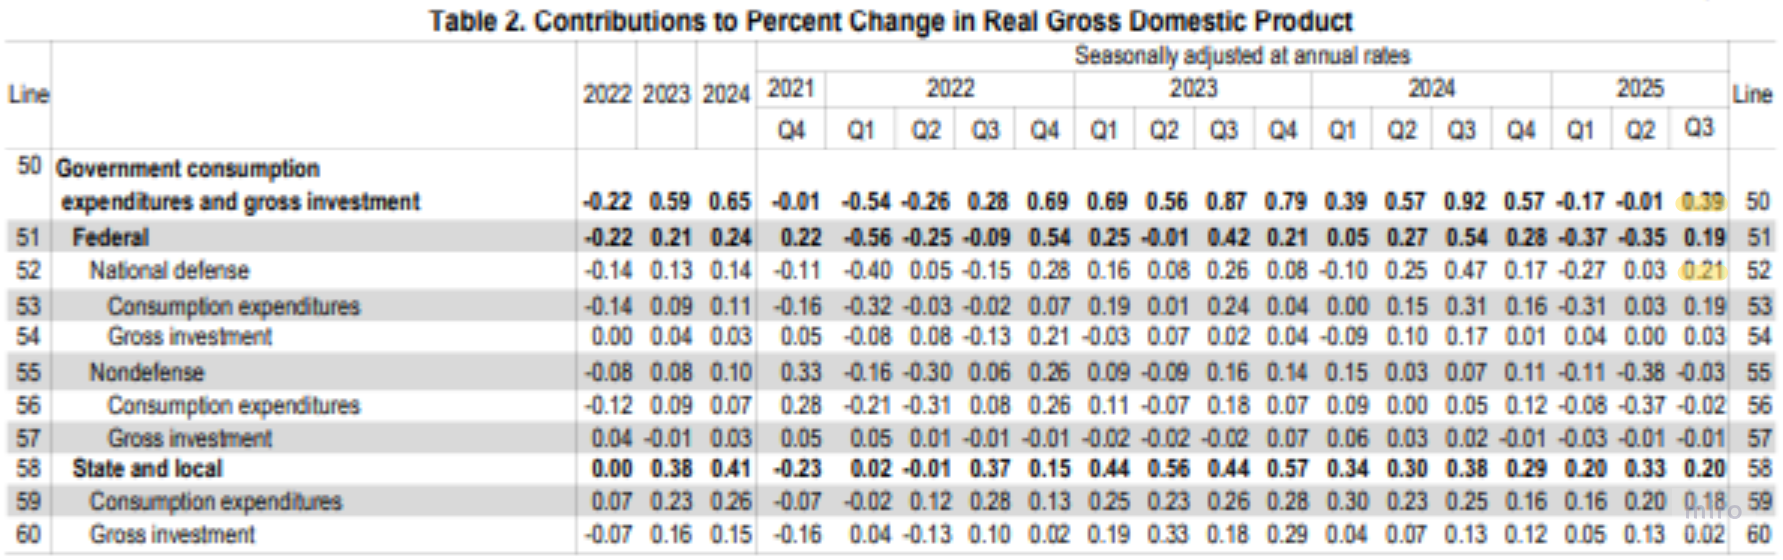
- Of the +0.39pp GDP contribution, defense accounts for +0.21pp.
3. The GDP vs GDI Gap
(1) The gap itself is a signal
- Q3 GDP growth of 4.3% vs GDI growth of 2.4% is a wide gap.
- The BEA explains the difference as a "statistical discrepancy."
- Q3 is traditionally strong on summer consumption, and this quarter saw travel / leisure demand concentrate and lift spending.
- The federal shutdown that began in late September injected volatility into the tabulation of government spending and data production. This quarter's data was released later than usual due to the shutdown, and such administrative variables can make short-run GDP swings look exaggerated relative to the actual cycle.
(2) The shutdown intervened in the data / estimates
- The BEA states the Oct–Nov 2025 shutdown delayed key source data, so the initial Q3 GDP estimate blended the data and methods normally used for the "advance + second estimate."
- The BLS likewise noted the September employment release was delayed more than six weeks by the shutdown.
Read-through: in this environment the revision risk on the initial GDP print is larger than usual. A balanced view that weighs core GDP (3.0%) and the income metric GDI (2.4%) together is required.
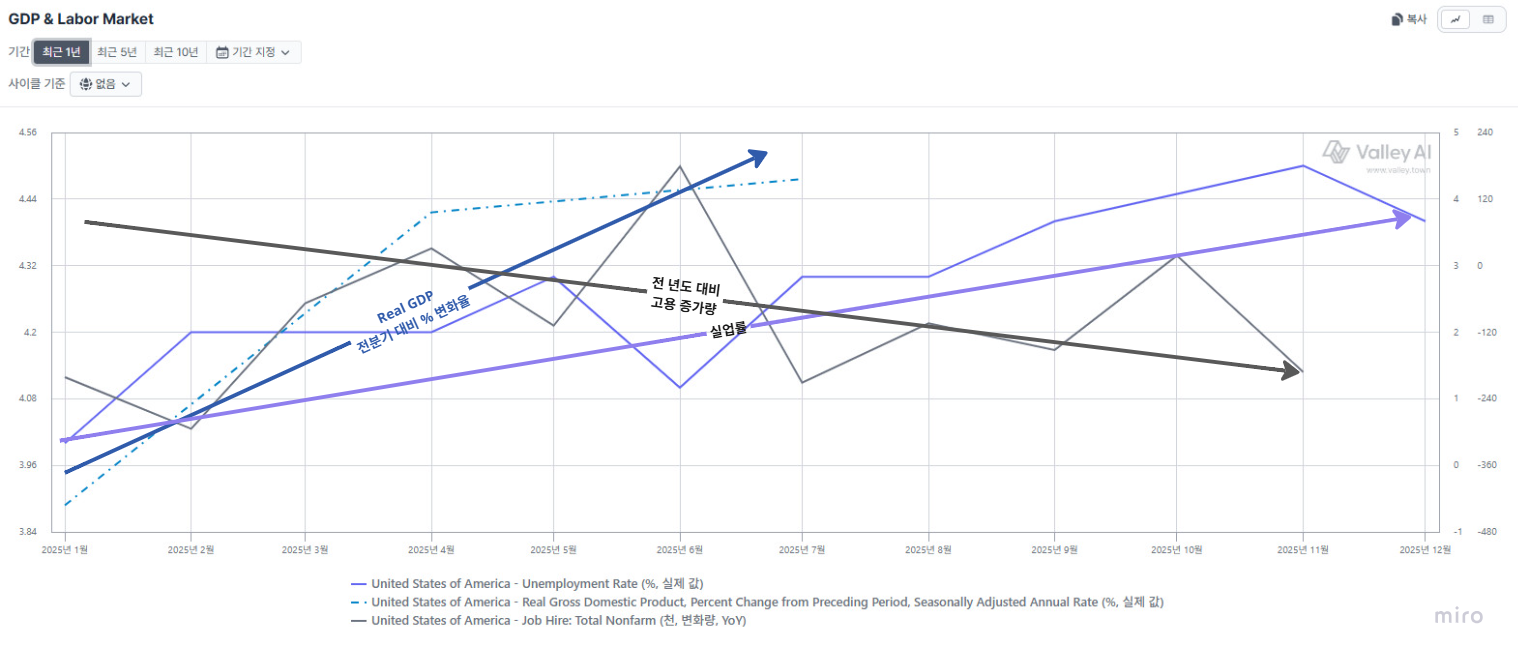
4. The Employment–GDP Disconnect
Trailing 1-year
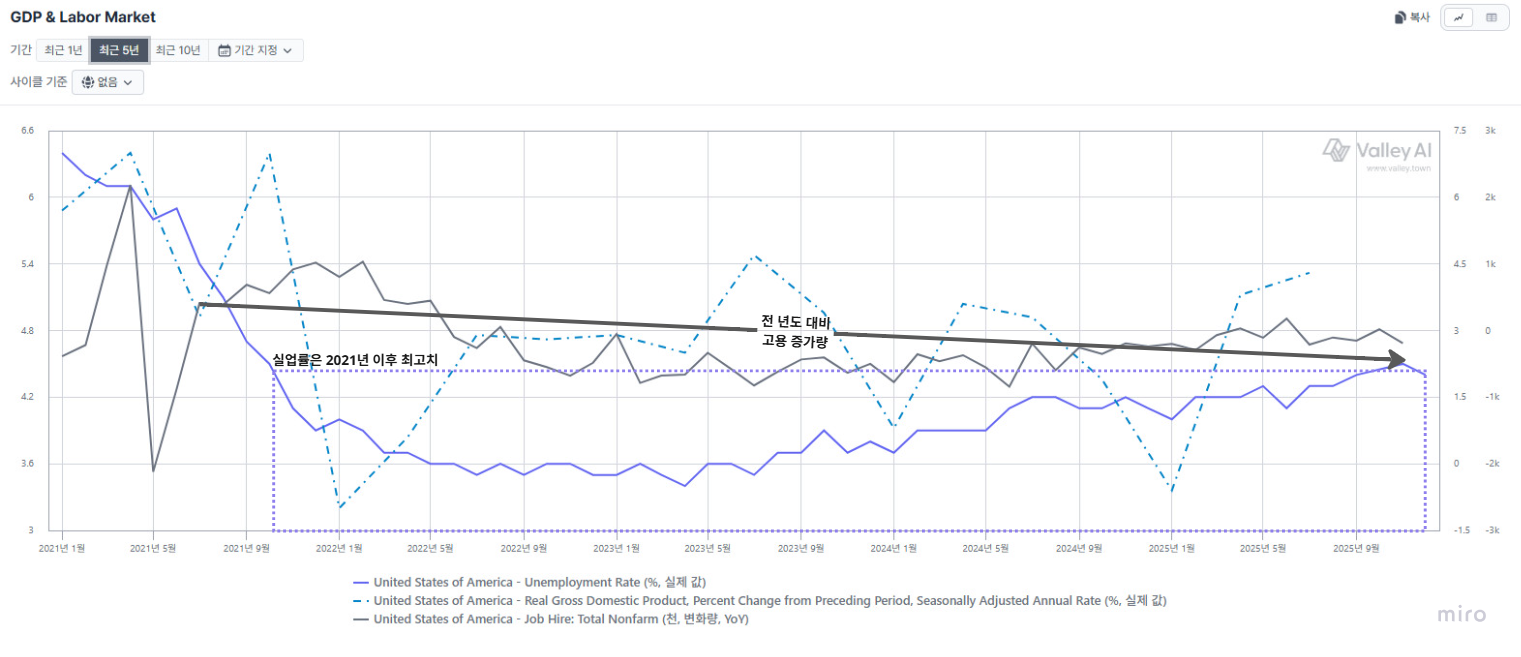
Trailing 5-year
- Through 2025 the decoupling — real GDP growth and the labor metrics pointing in opposite directions — has become more pronounced.
- Q3 average monthly job gains were ~35k, less than half the prior year, and the unemployment rate is at its highest since 2021.
Why strong GDP without an employment acceleration:
- Growth is tilting toward data-center / IT sectors that produce enormous output with few workers — likely a transient phenomenon rather than an economy-wide efficiency gain.
- Structural shifts in hiring (automation capex, more contingent labor for cost control) are lowering employment elasticity further.
- The "K-shaped consumption structure" — upper-income spending, ~half of total US consumption, concentrating in low-labor-intensity areas like travel and asset management — can also block headline high growth from spreading as warmth across the broader labor market.
5. Conclusion
- Personal consumption and net exports drove the headline strongly, but that rests substantially on sustained upper-income spending and a technical adjustment in external trade. In particular, the record gap between the output-side metric (GDP) and the income-side metric (GDI) is important evidence that the high print may not fully represent the US economy's actual strength.
- AI-related investment is clearly emerging as a new growth driver and contributing materially to the prints. But so far it is unfolding around specific capital-intensive industries, so it is still premature to judge it as having spread into an economy-wide, universal productivity revolution.
Current high growth therefore sits between two opposing currents — an AI-skewed investment structure and a cooling labor market — and the US growth trajectory will be decided by how the performance and direction of these two factors interlock.
(1) Q3 2025 GDP Revisions
On Jan 22 the Q3 GDP revision was released, lifted from the prior +4.3% QoQ to +4.4% (+0.1pp). The upward revision reflects (1) wider personal consumption, (2) higher government spending and investment, and (3) higher net exports from rising exports and a slowing import increase. The implication does not differ much from the conclusion above.