Datacenter Power Supply Pt. 2 | Bloom's Advantages, 800 VDC, and the Numbers
- Part 2 of 2 — "Datacenter Power Supply." This part covers Bloom Energy's advantages, its 800 VDC fit, the detailed financials and valuation, and the risks.
- Part 1 covered the datacenter power-supply bottleneck and the shift to behind-the-meter (BTM) generation, and why fuel cells are drawing so much attention here.
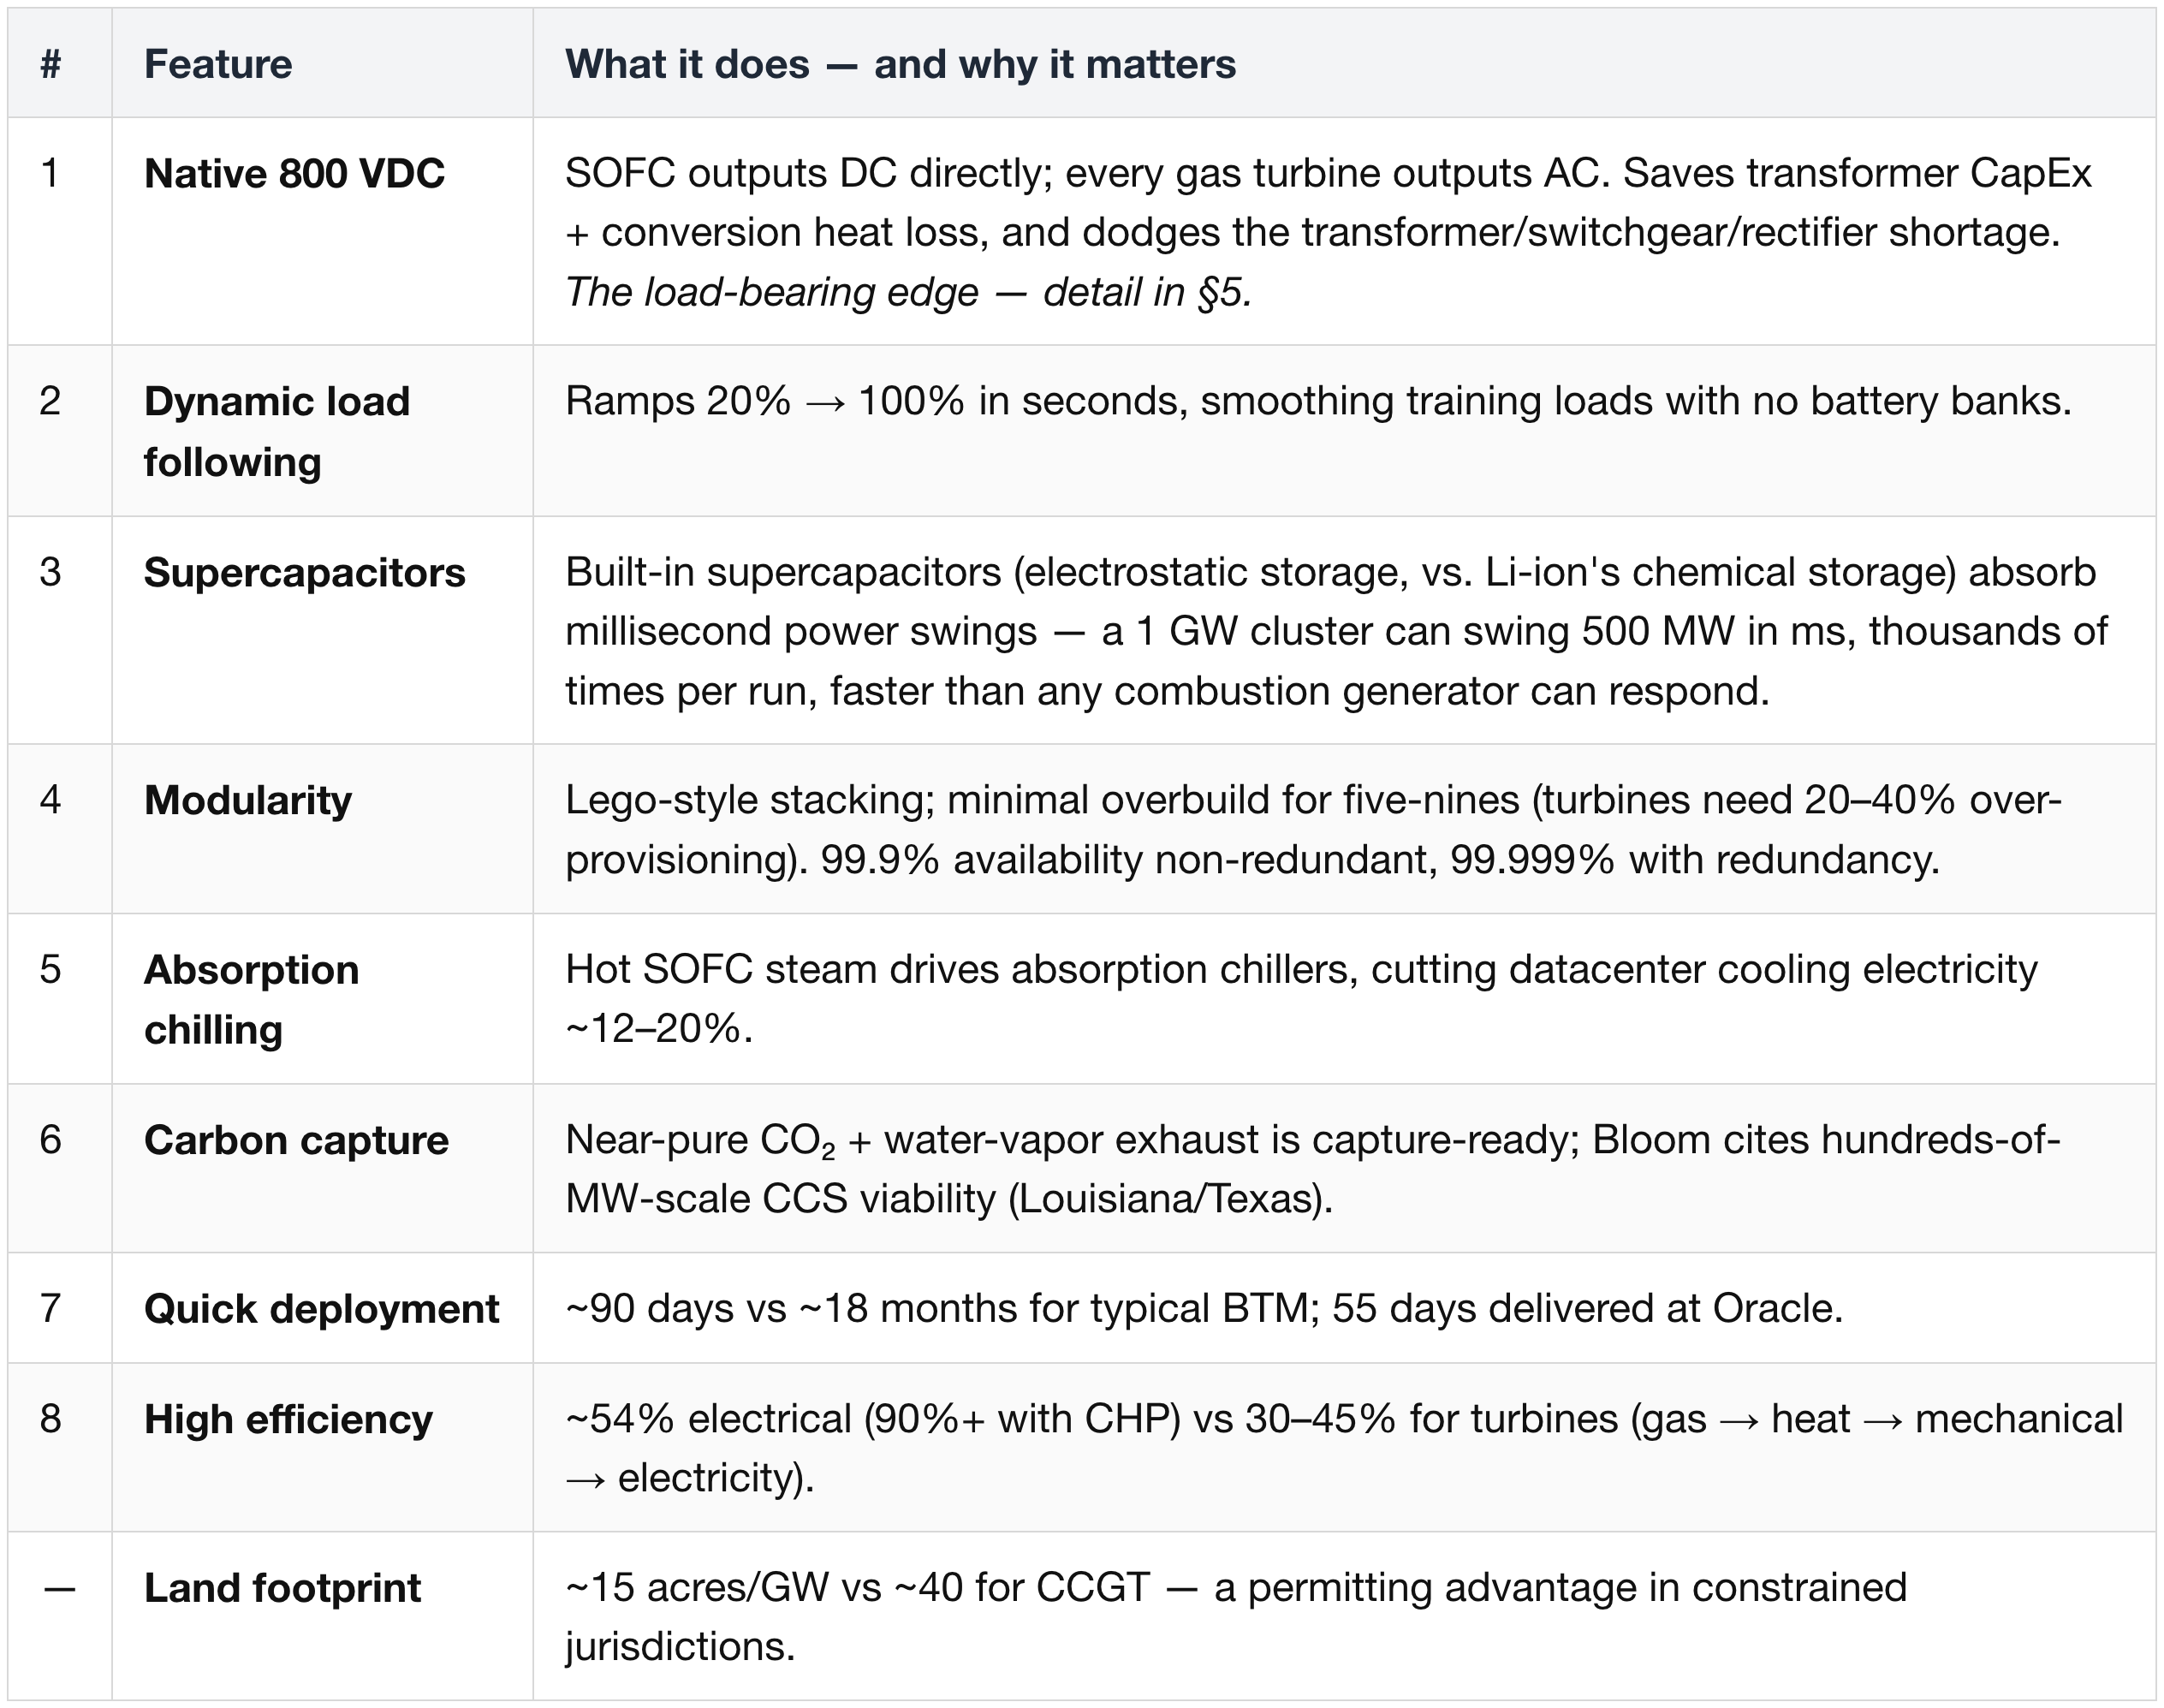
4. The Advantages of Fuel Cells (Bloom's Eight Features)
In management's words, on the native-DC and load-following edges: "the world does not have enough copper… does not have enough transformers" and "no battery banks for load following" (KR Sridhar, CEO, Bloom Energy — Q1 '26 earnings call, Apr 2026).
Unit-cost reality:
- Installed system CapEx is $3,100–4,000/kW pre-incentive.
- The 30% Section 48E Investment Tax Credit (restored through 2033, regardless of emissions) brings that to roughly $2,200–2,800/kW,
- and stacking bonuses (domestic content + energy community, up to ~50%) push it toward ~$1,600–2,000/kW.
- (Bloom's all-in customer cost including its long-term service contract is sometimes quoted higher — ~$5,000/kW pre-ITC, ~$3,500 post — but that's a service-inclusive basis, not the equipment-plus-install figure here.)
- Variable cost — essentially the natural gas burned per MWh — runs only ~10% above CCGT, because Bloom's ~54% electrical efficiency is close to a combined-cycle plant's ~55–60% heat rate.
- The swing factor: stack replacement every ~5 years at ~$1,000/kW (≈30% of system cost) — recurring service revenue, but single-vendor TCO risk.
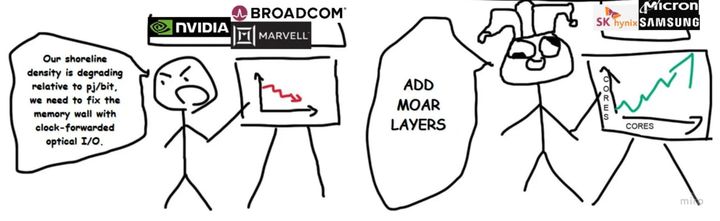
5. Why Fuel Cells Are Preferred Under 800 VDC
5.1 The physics and the rack-density roadmap
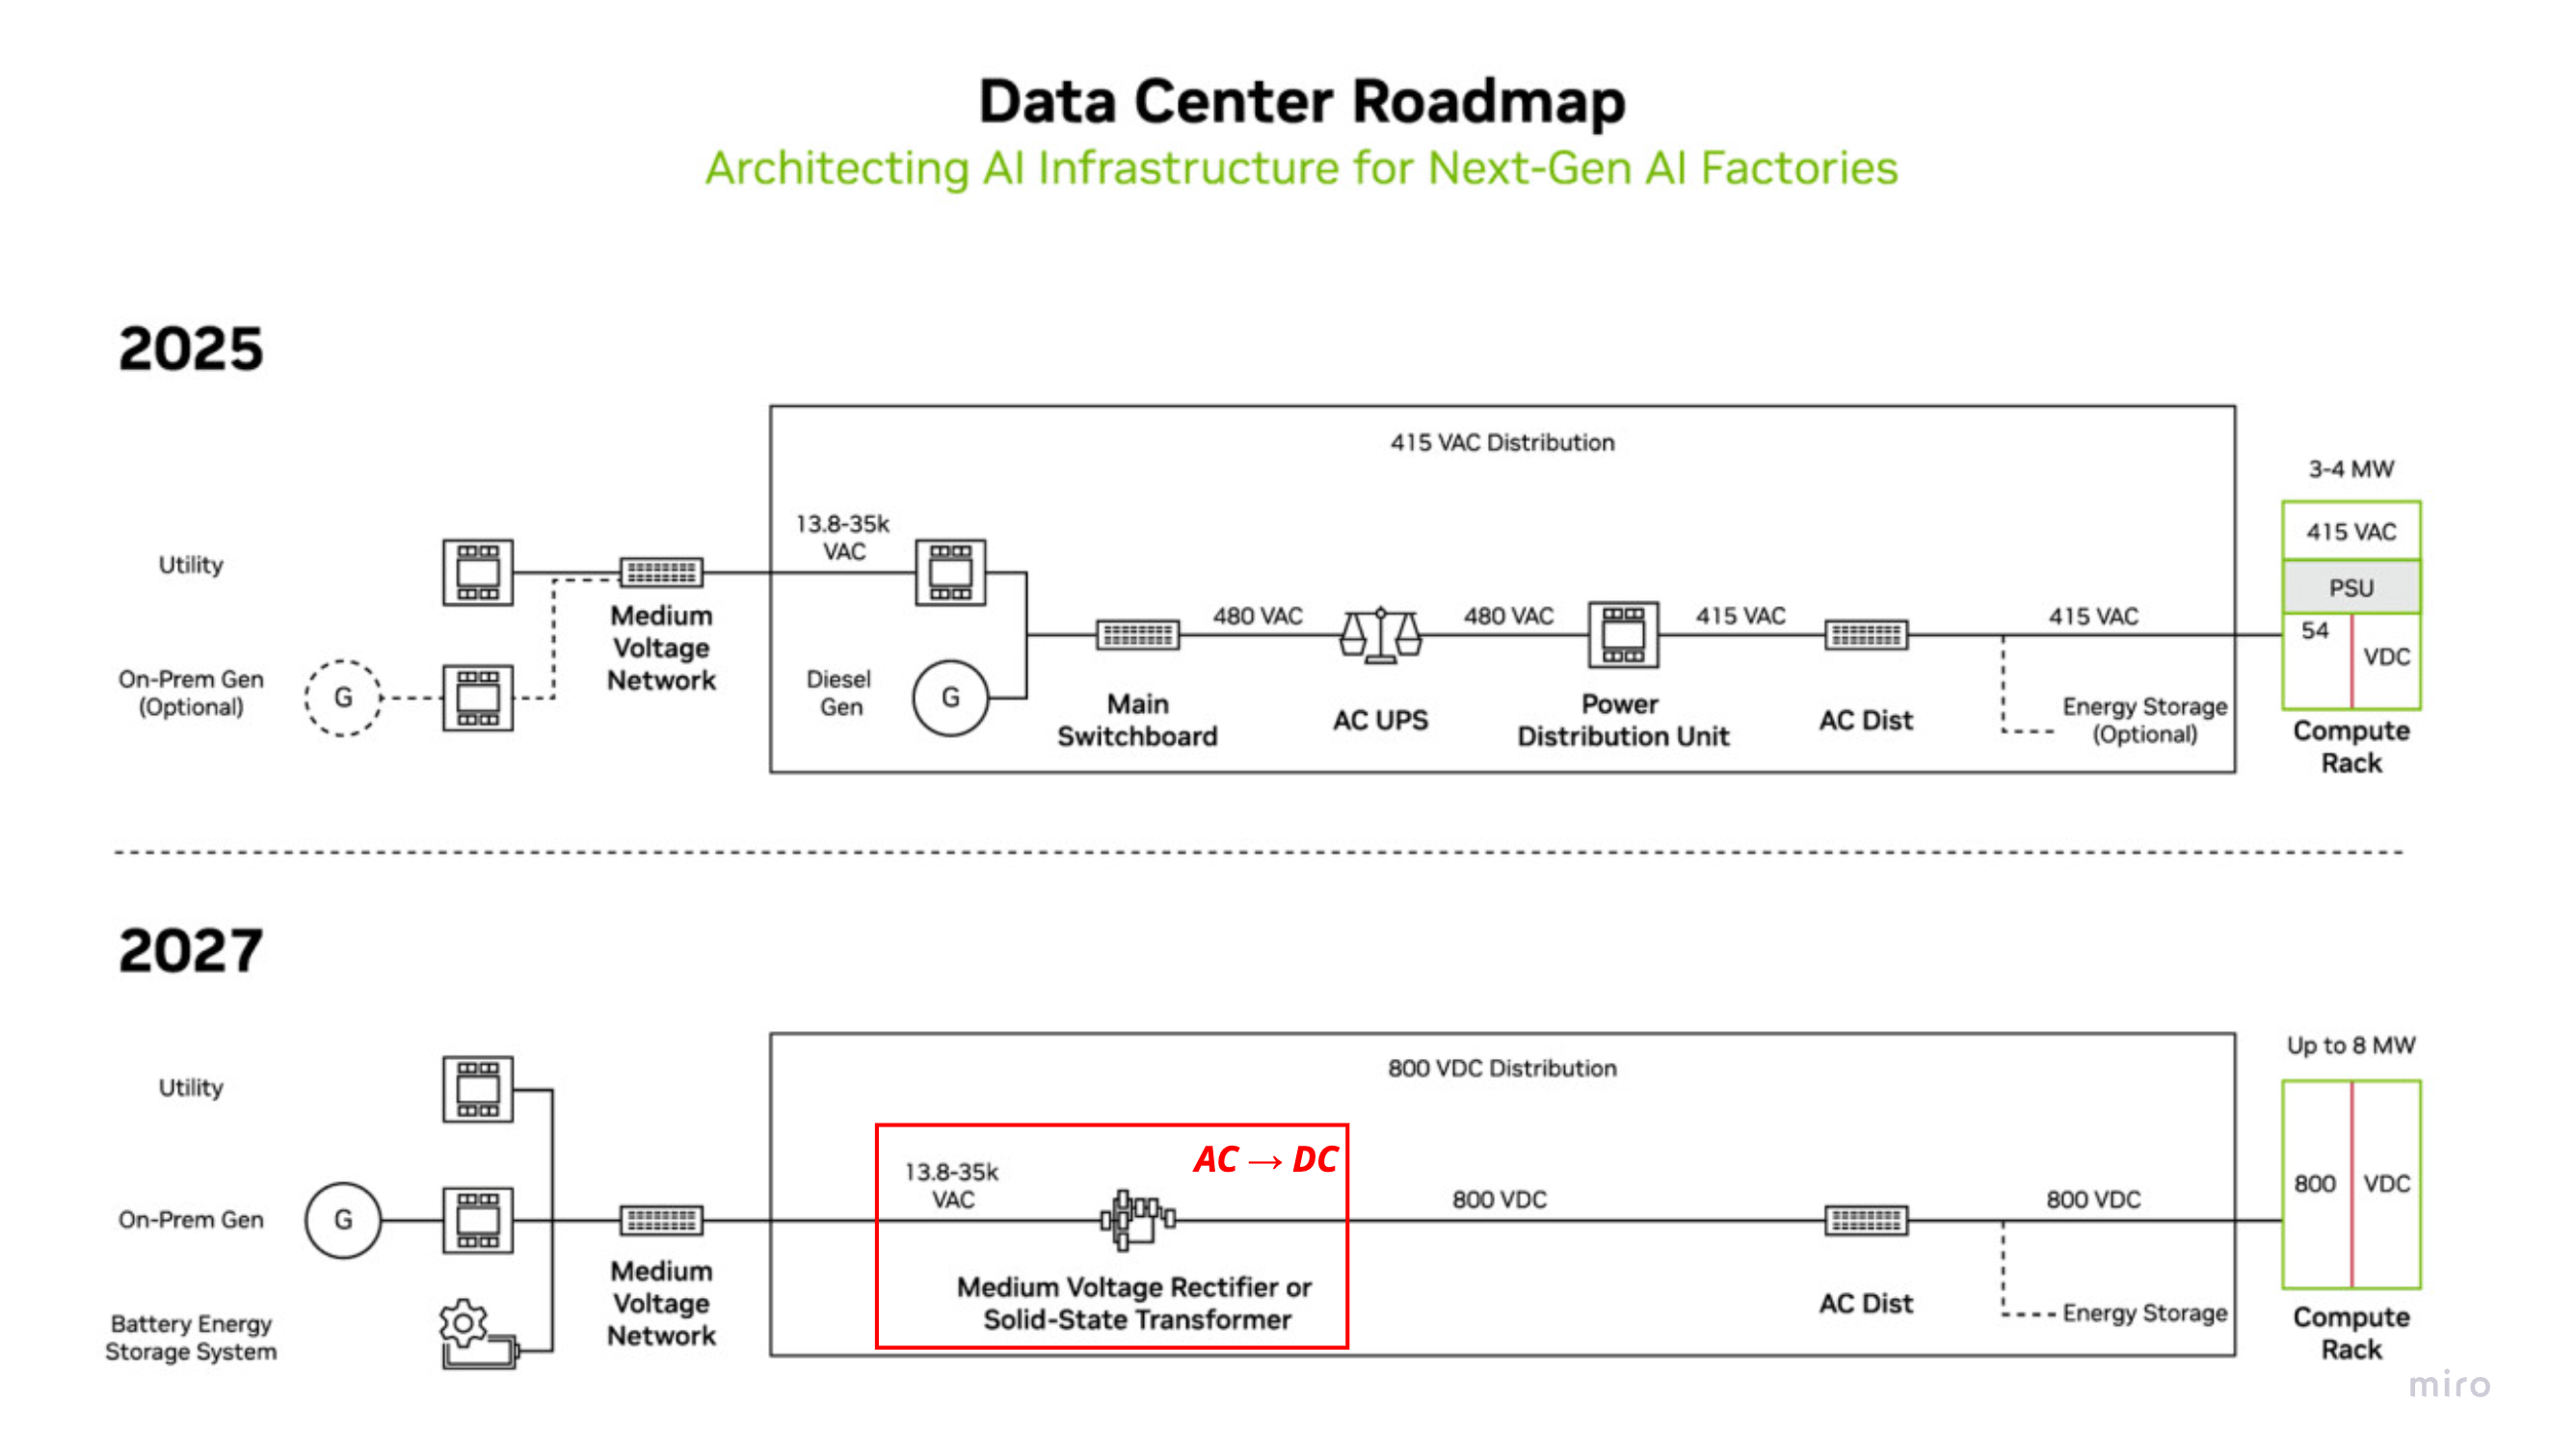
- Rack power is exploding, and 800 VDC is the only scalable answer:
- Hopper / H100: ~40 kW (54 VDC in-rack)
- Blackwell / GB200–GB300 NVL72: 100–120 kW (480 VAC still adequate)
- Vera Rubin NVL72 (2H '26): 190–230 kW (transitional)
- Rubin Ultra NVL576 Kyber (2H '27): 600 kW+ (→1 MW), mandates 800 VDC (14× perf over GB300)
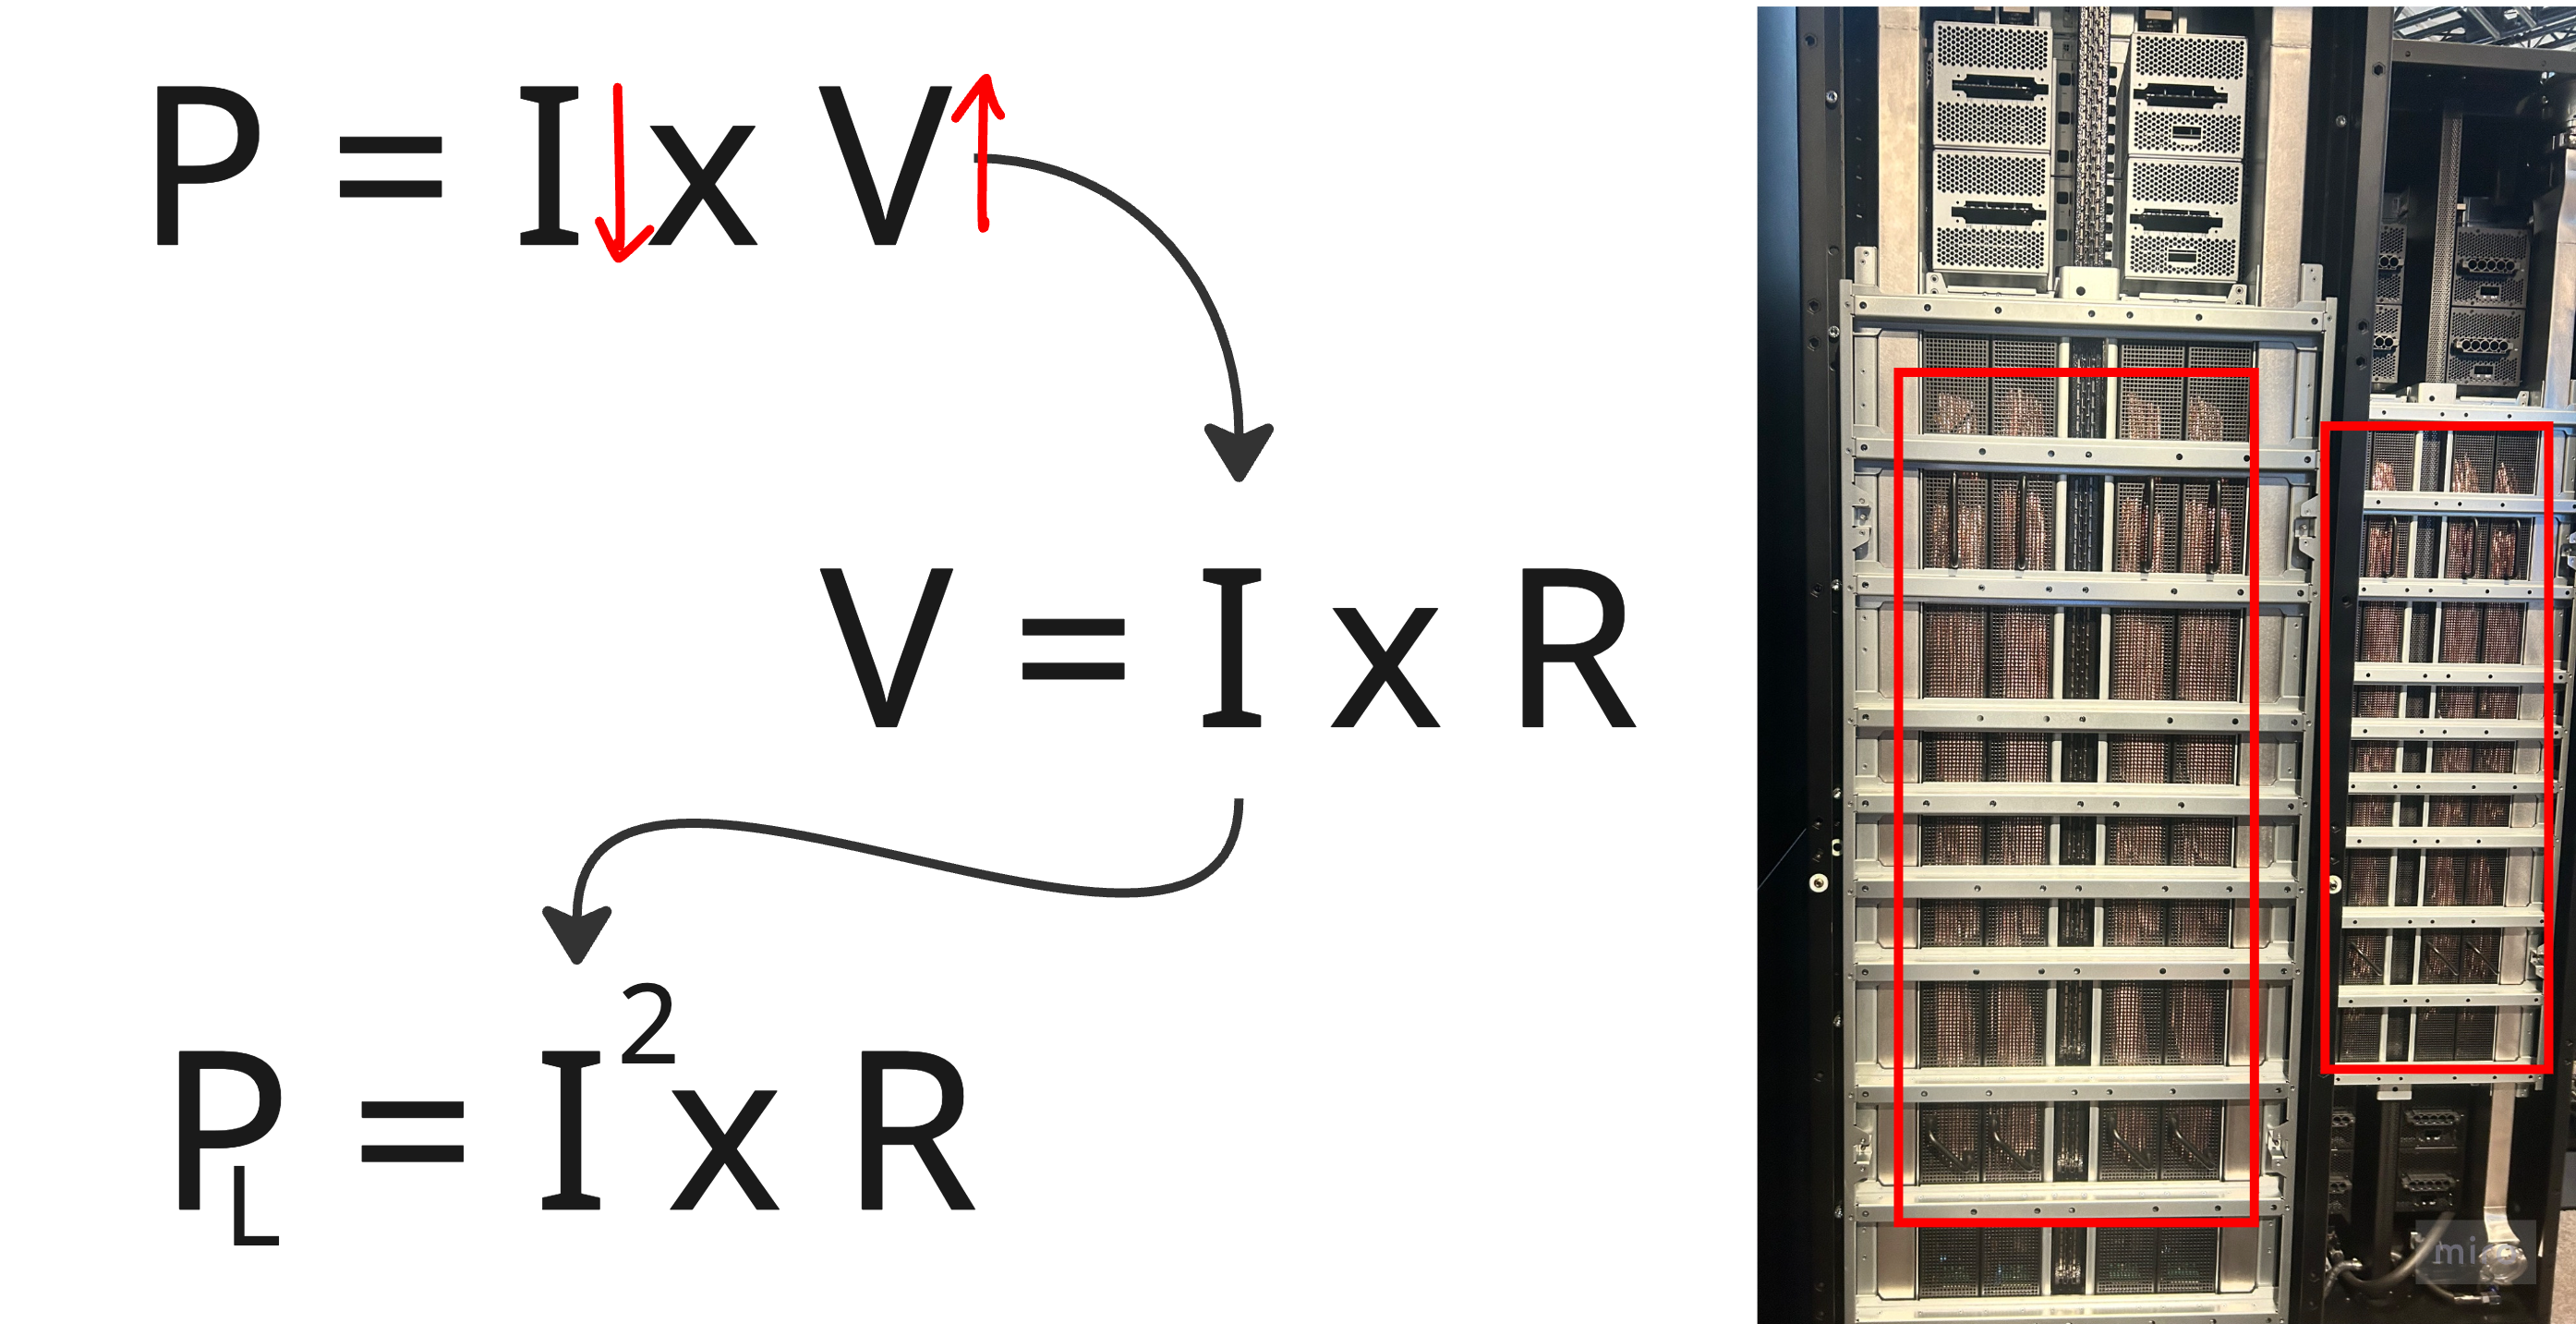
- The physics: P = I × V, and resistive loss scales with the square of current, so raising voltage to cut current is disproportionately powerful.
- At 54 VDC, a 1 MW rack needs up to 200 kg of copper busbar (200,000 kg per 1 GW datacenter).
- 800 VDC carries ~157% more power than 415 VAC through the same conductor (~45% less copper), with up to 5% better end-to-end efficiency — framed vividly as "5 GW of power appearing from existing infrastructure for every 100 GW needed" (Eaton — Barclays Industrial Select Conference, 2026).
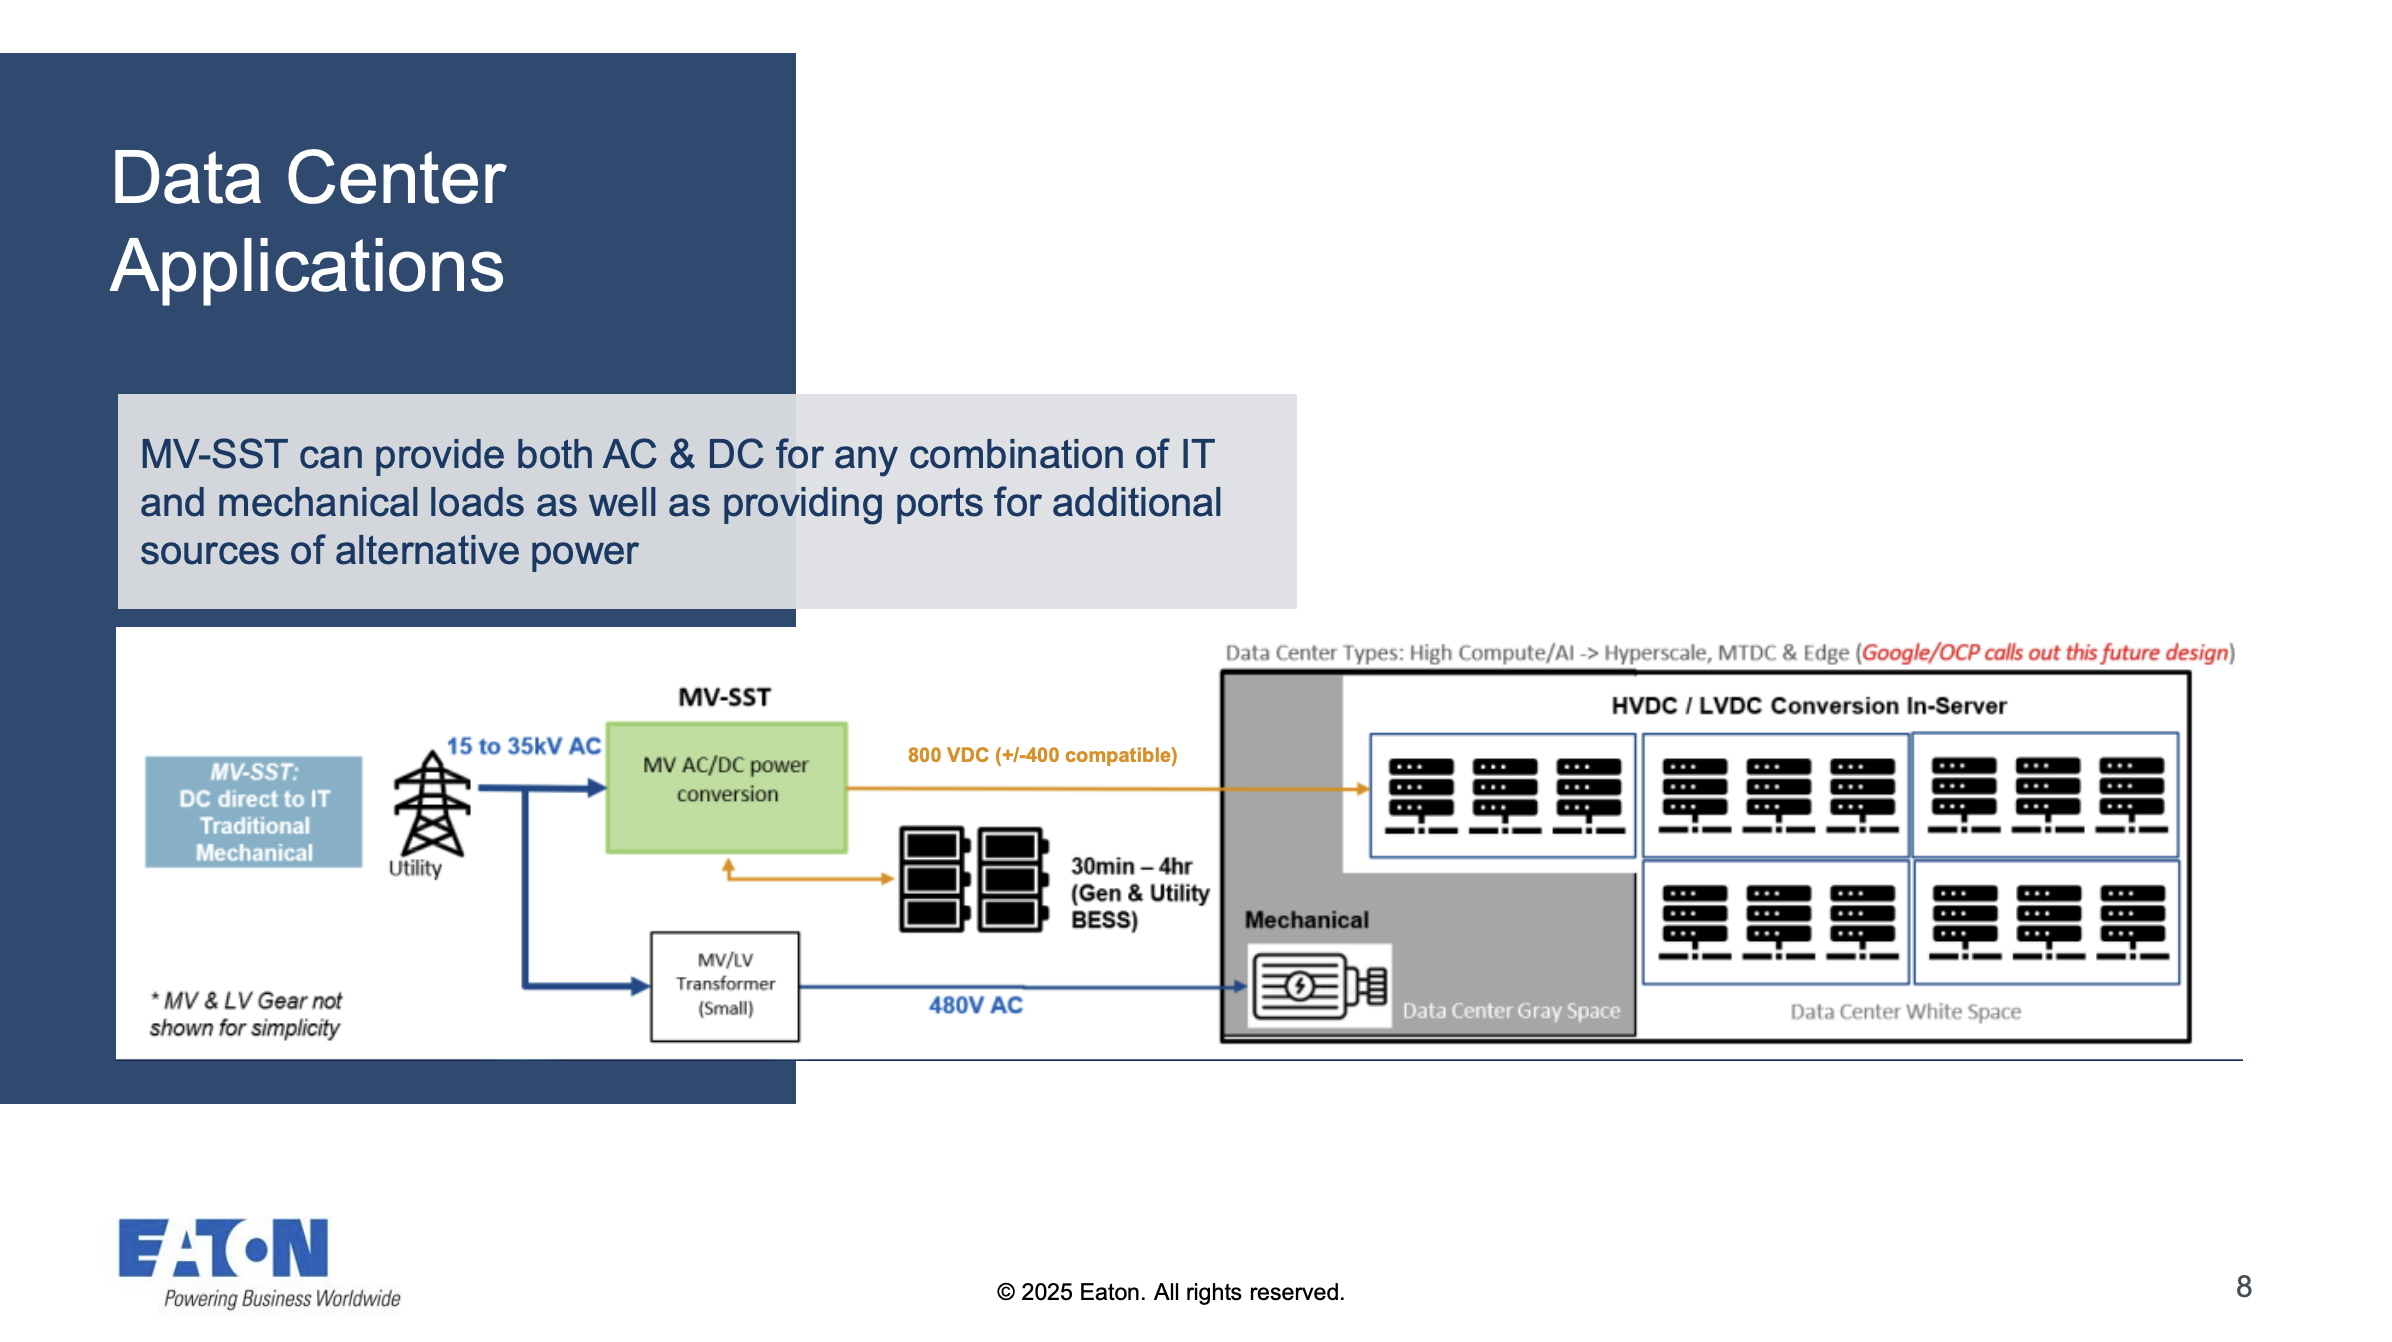
- The architecture centralizes AC→DC conversion at the facility edge (13.8 kVAC → 800 VDC; the red box on the diagram above), distributes 800 VDC, and does only DC/DC in-rack — eliminating rack PSUs, switchgear, PDUs, and transformers, and freeing white space for compute.
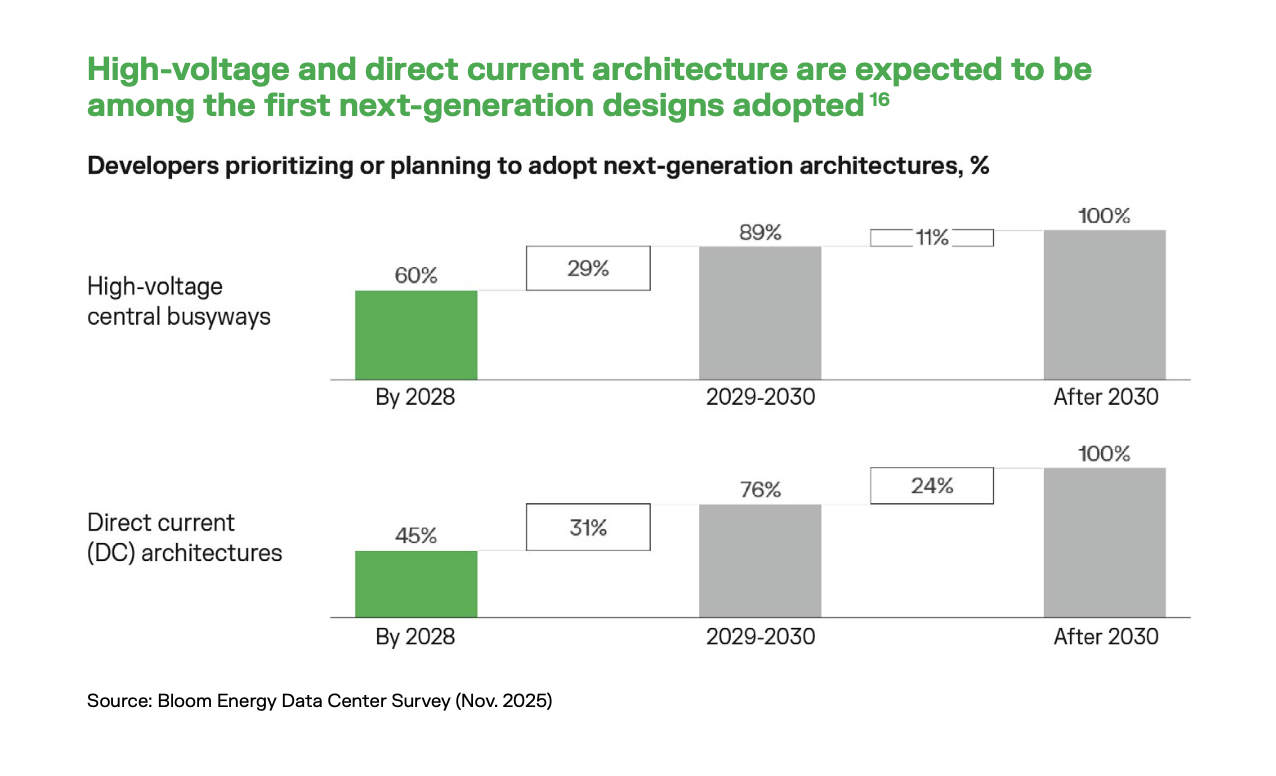
The transition is expected to be quick: in Bloom's Nov 2025 survey, DC architectures reach ~45% adoption by 2028 (high-voltage central busways ~60%), heading toward effectively 100% after 2030 (Bloom Energy internal survey).
5.2 Why native-DC generation is the natural plug-in
- Once the backbone is DC, the lowest-emission source also outputs DC — avoiding an extra AC→DC conversion at the generation step.
- SOFC outputs DC natively; turbines and gensets output AC and need lossy rectification to reach the DC bus.
- Bloom is the only provider shipping 800 VDC natively today, eliminating transformers, switchgear, and UPS equipment.
- The decisive driver is supply-chain, not marginal efficiency: large power transformers, medium-voltage switchgear, and centralized rectifiers are all in long shipment queues, so native DC dodges a second bottleneck.
5.3 The honest counter-thesis: who captures the 800 VDC value?
The transition is source-agnostic — someone must build, protect, distribute, and service the 800 VDC plant regardless of input.
The value pool splits cleanly: Where Bloom wins — greenfield, off-grid, severely-constrained, speed-first sites:
- Speed-to-power (90 days vs 3–7-yr grid queues).
- Permitting-constrained markets (no HV/MV transformers, which are ~20% pricier since 2025).
- Islanded microgrids (Oracle Jupiter "100% Bloom," 2.45 GW).
- Minimal battery backup (ultracapacitors replace UPS).
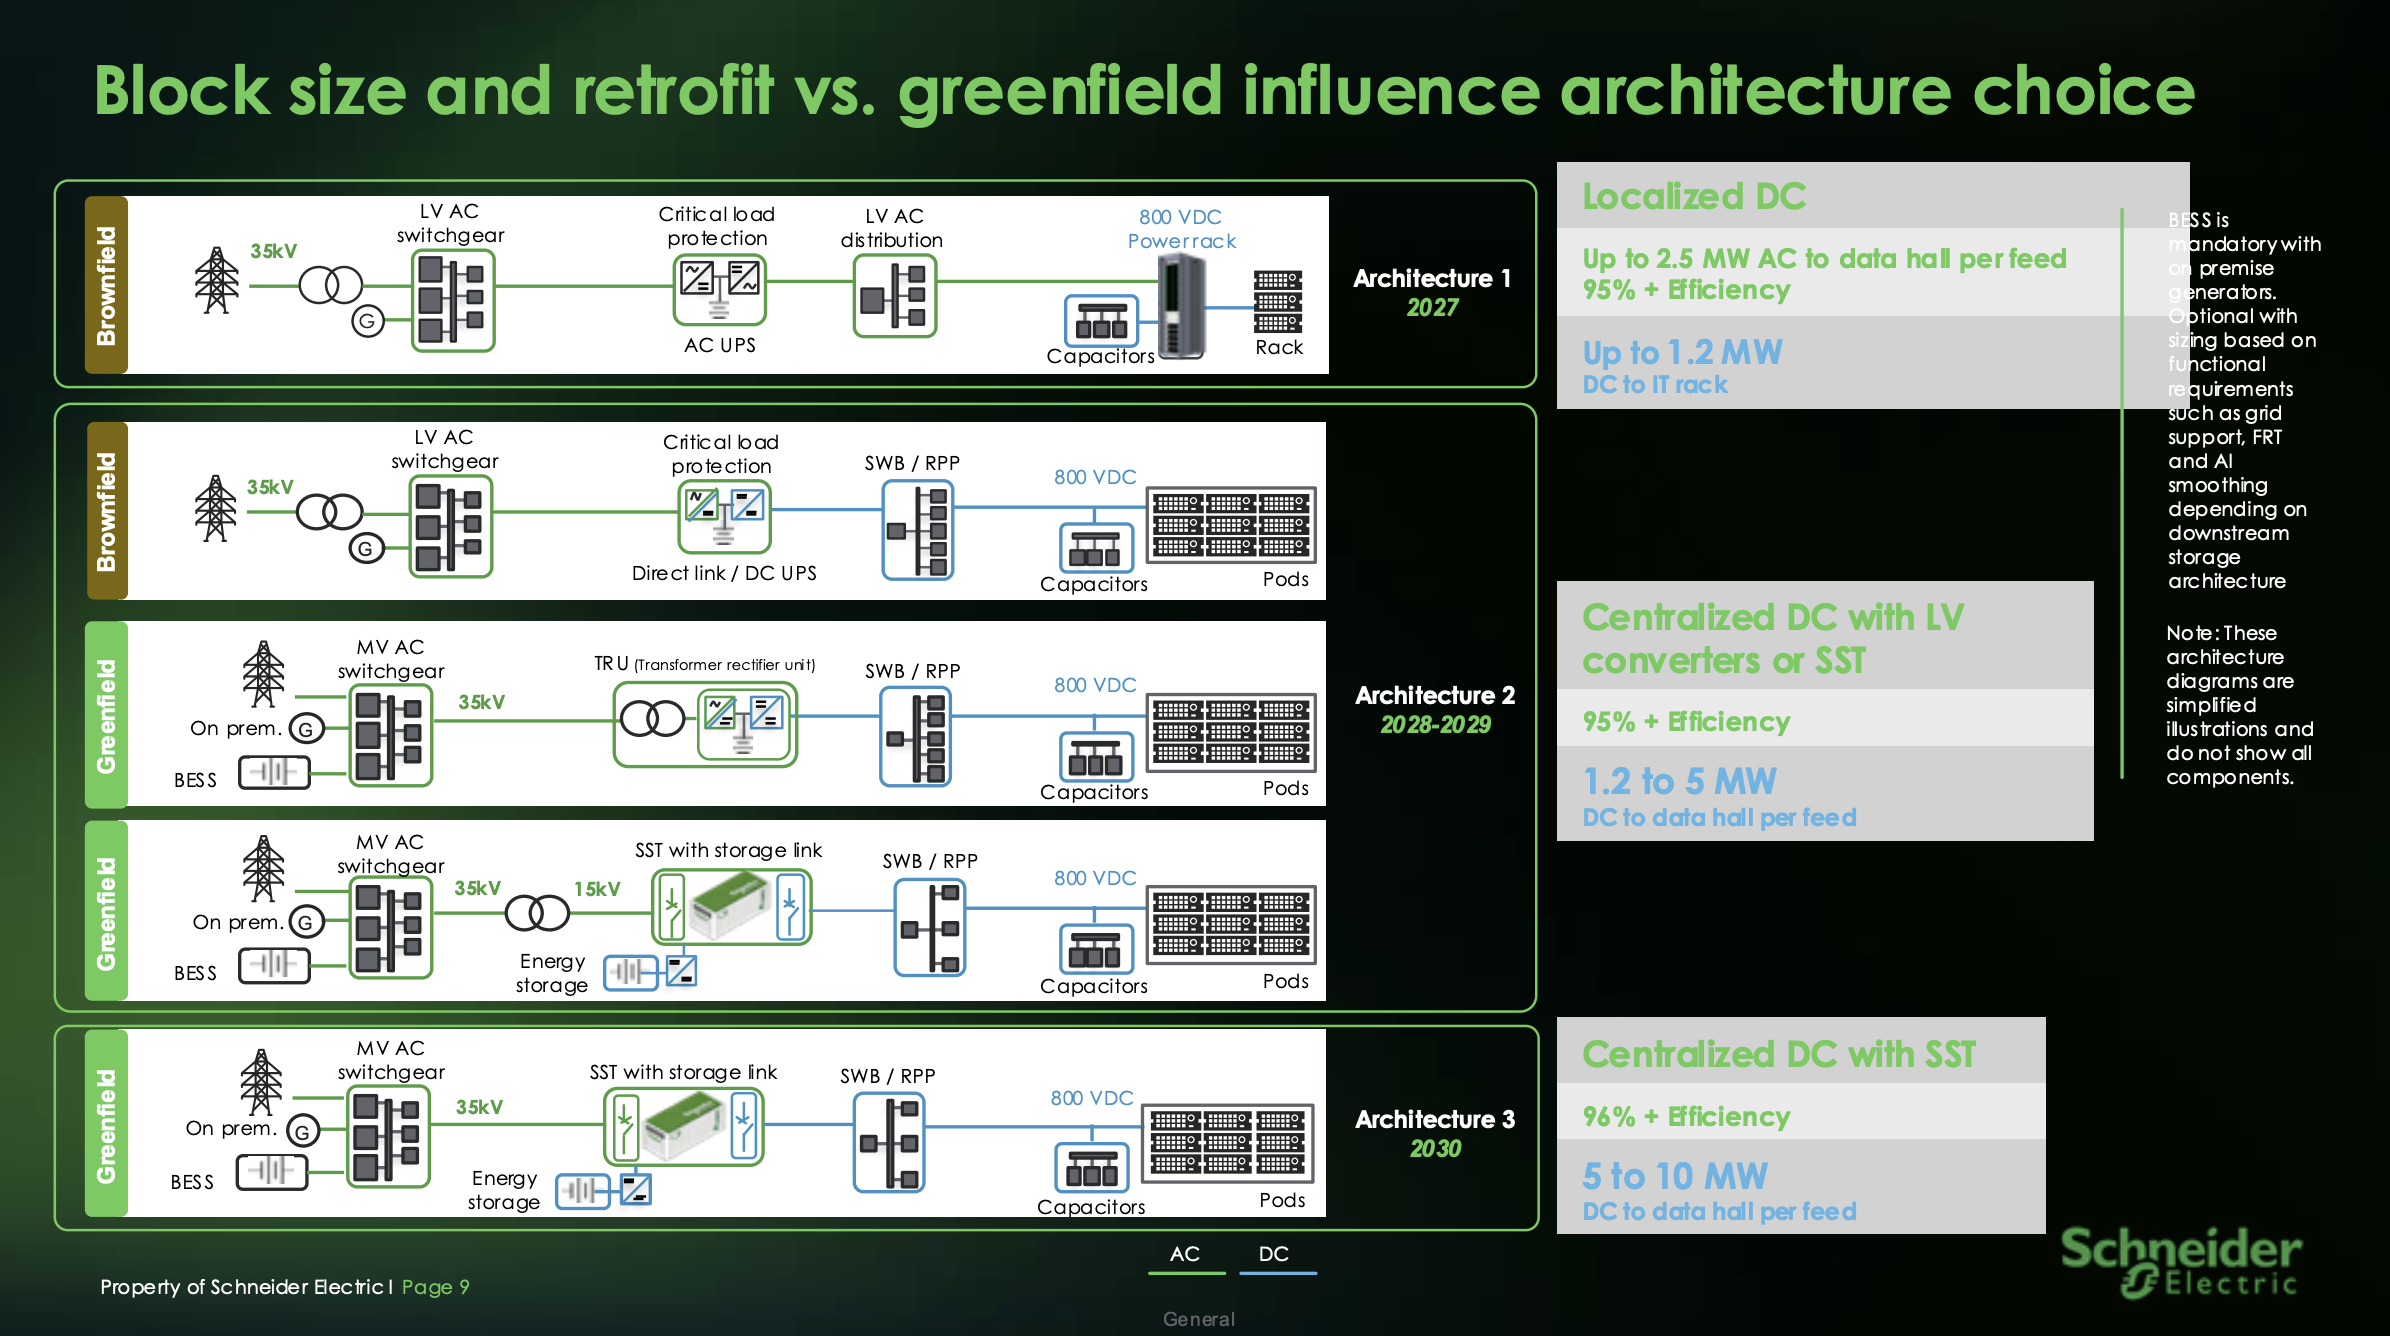
Where electrical OEMs win — grid-tied retrofits at scale, and the solid-state transformer (SST) is their weapon.
- An SST collapses the traditional chain — a 60-Hz medium-voltage transformer + rectifier + low-voltage distribution — into a single power-electronics stage that steps 13.8–35 kV AC straight down to 800 VDC.
- That one substitution is what removes the copper, the floor space, and a conversion stage.
(1) Vendor positioning
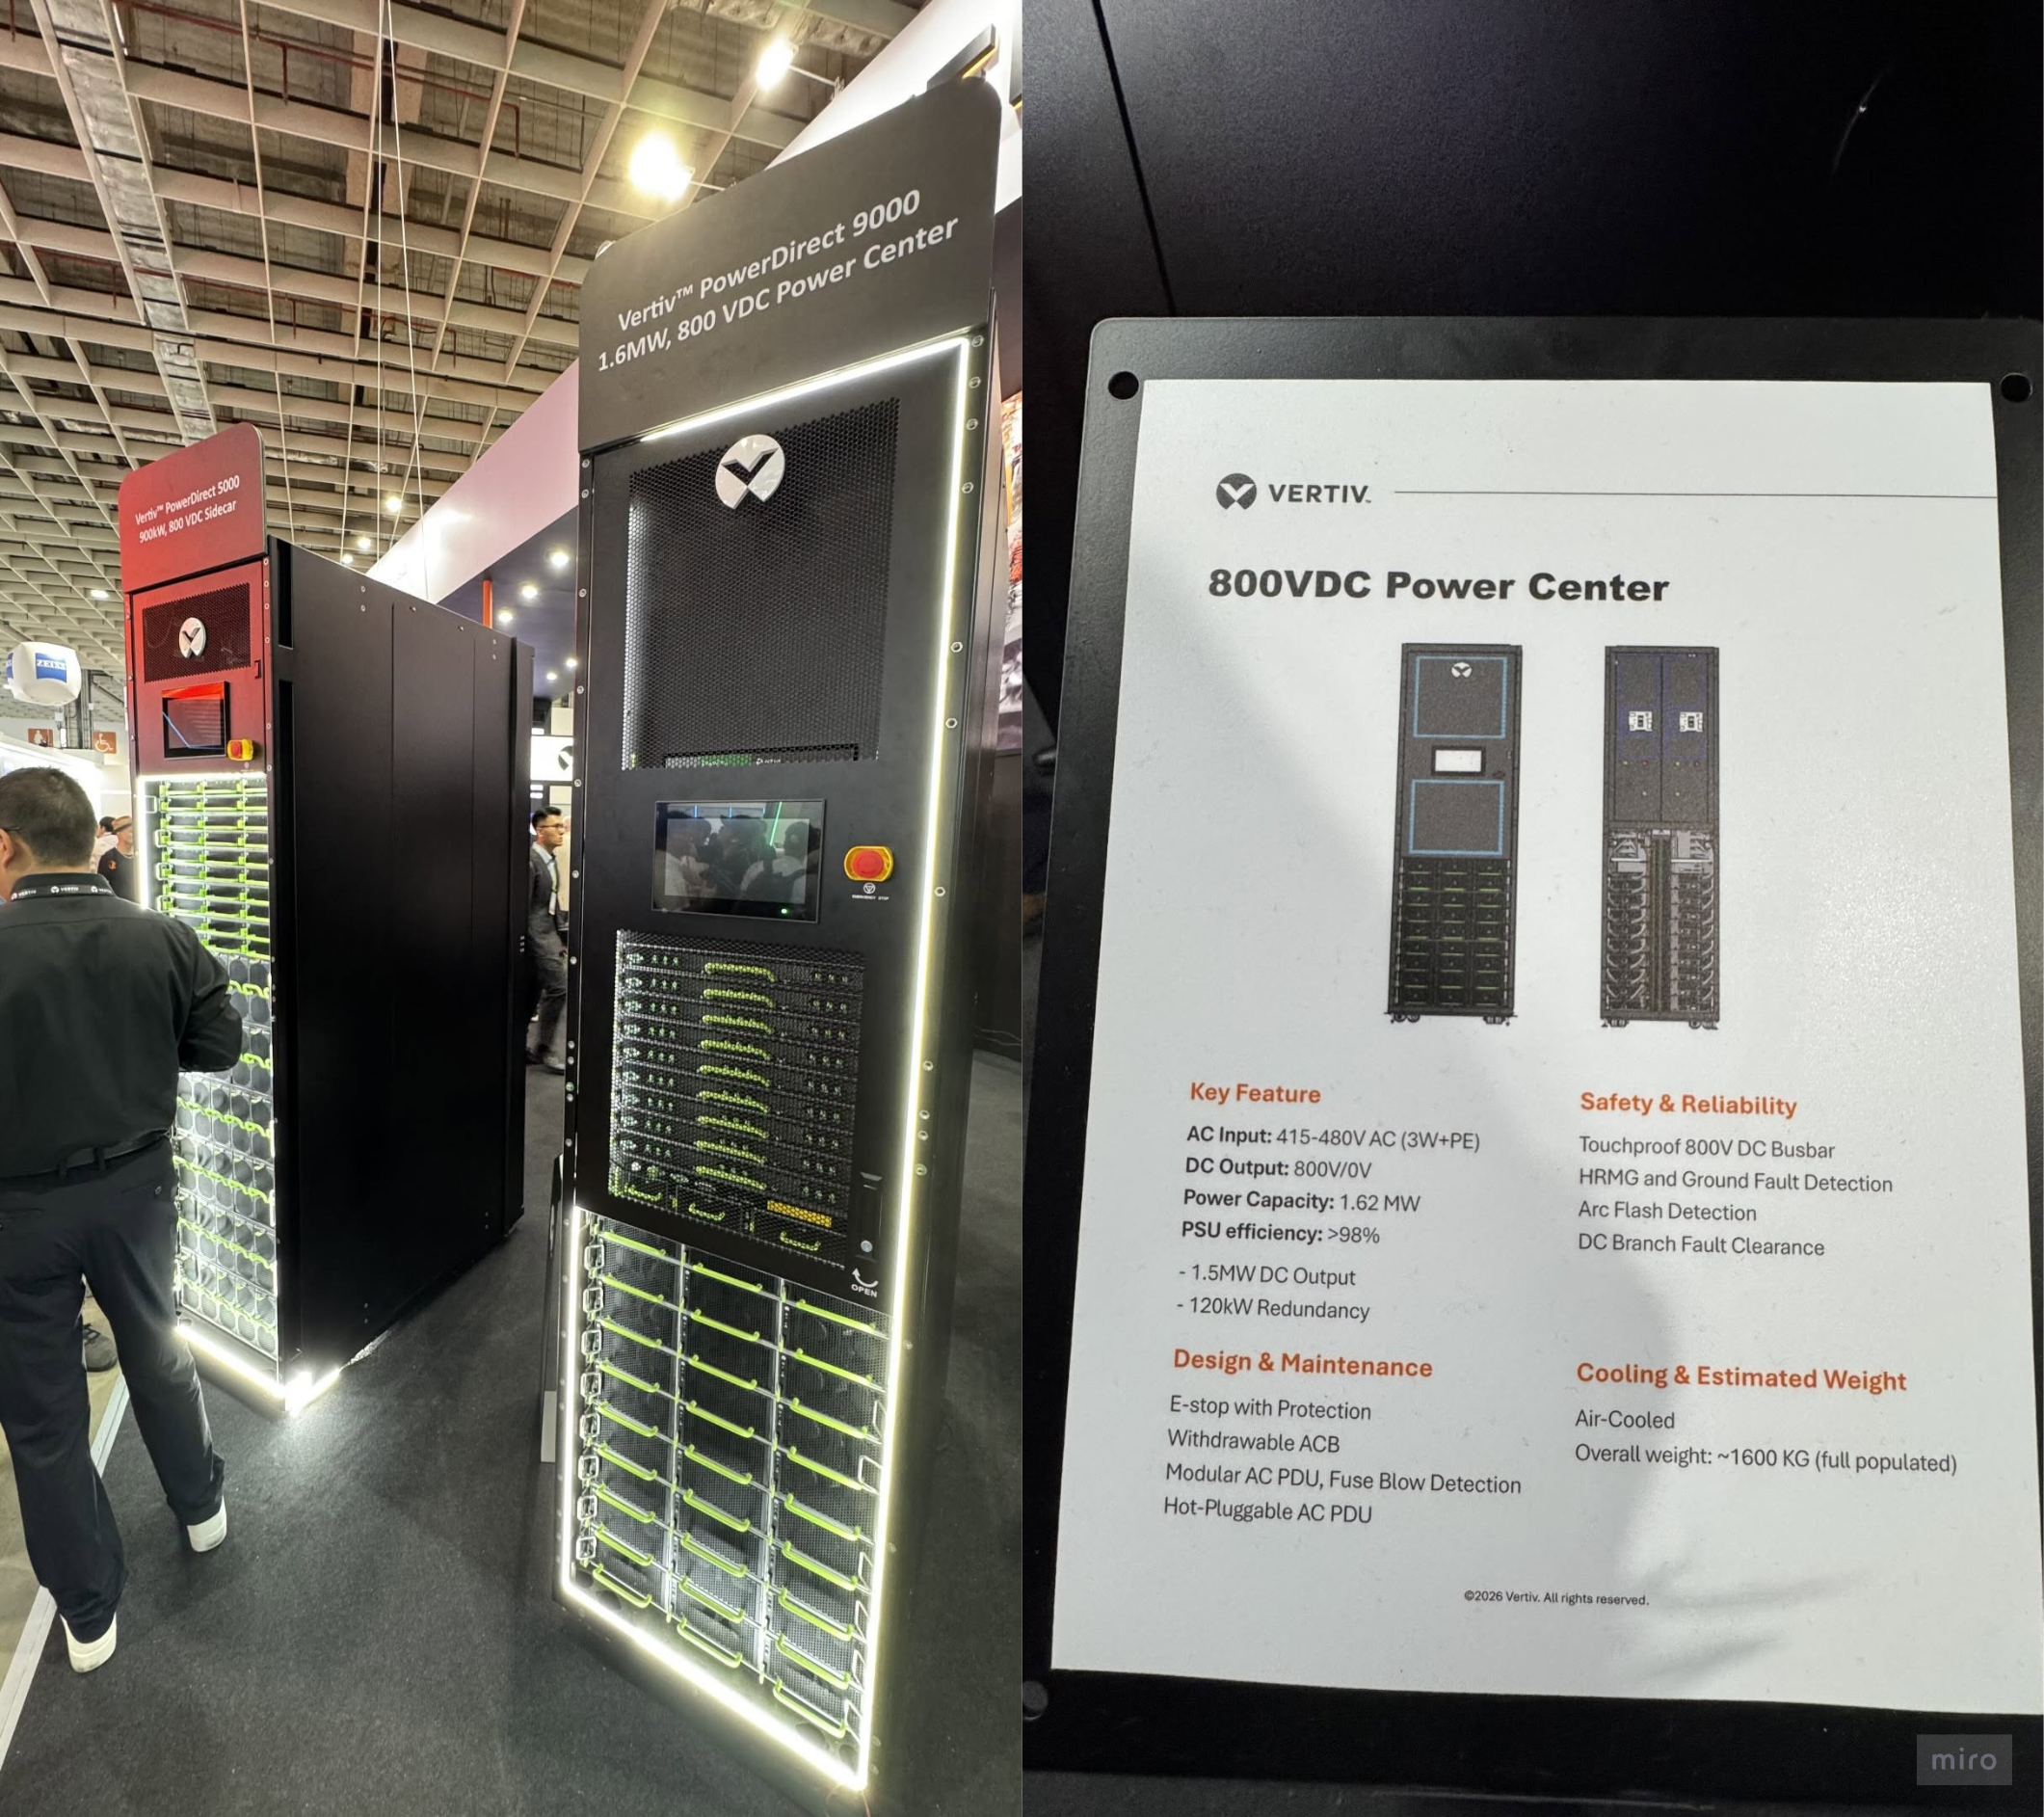
- Vertiv (NYSE: VRT) ships an 800 VDC "sidecar" / Power Center (PowerDirect 9000) — 1.62 MW, 415–480 VAC in → 800 V/0 V DC out, >98% PSU efficiency, 120 kW redundancy, >1,600 kg — converting at the row level for 400–900 kW racks; product ready end-2026.
- Eaton (NYSE: ETN) quotes 800 VDC for late-2027/2028, delivered a complete Vera Rubin solution, and acquired Resilient Power for SSTs.
- Schneider Electric (EPA: SU) targets its first project in 2H '27.
- Localized DC (2027): ≤2.5 MW AC to the data hall per feed, ~95% efficiency, ≤1.2 MW DC to IT — the near-term retrofit.
- Centralized DC with LV converters or SST (2028–29): ~95% efficiency, 1.2–5 MW DC per feed.
- Centralized DC with SST (2030): ~96% efficiency, 5–10 MW per feed — the end-state.
(2) The SST (Solid State Transformer) economics, in detail
- Cost trajectory. An SST runs $1,500–2,000/kW today (early, low-volume builds), but hyperscaler scale is expected to drive it toward an indicative ~$250/kW — close to an order-of-magnitude cost-down as volume ramps into 2028–2030.
- Where the savings come from. Collapsing the transformer + rectifier into one stage cuts roughly 50% of the conversion footprint, saves about $50–60/kW of cabling, and adds ~1 percentage point of end-to-end efficiency — which, on a 1 GW campus, is worth on the order of $8–10M/year in avoided conversion losses.
- The moat. These are mission-critical, high-fault-energy systems; the incumbents hold ~70–80% of installed power-equipment share plus the field-service network to commission and maintain them — a barrier a pure generation vendor like Bloom does not cross.
Sober reality check:
- Fuel cells remain <5% of the datacenter power market after 10+ years and still need years of testing to validate cost and reliability;
- SST mass adoption is itself a 2028–2030 event. So the 800 VDC value pool is large and contested — and most of the conversion layer accrues to Vertiv / Eaton / Schneider regardless of who generates the power.
Read:
- The "voltage match" is a real but secondary edge;
- the durable driver is bring-your-own-power speed + grid independence.
- Bloom wins the on-site-DC-generation subset; Vertiv/Eaton/Schneider capture the larger grid-tied conversion build-out. Both are real, distinct value pools.
5.4 The competition question: GE Vernova's SOFC entry
At its December 2025 Investor Update, GE Vernova (NYSE: GEV) named solid-oxide cells (SOFC/SOEC) a "beyond-2028" project — and Bloom fell ~7.5% on the news. The details, though, argue the threat is smaller and later than that reaction implied.
Different cell, different target. Both share the fuel-electrode / electrolyte / air-electrode structure; the support layer differs:
- Bloom = electrolyte-supported (ES-SOFC)
- a zirconia ceramic plate carries the cell.
- Simple materials, 800 °C operation, tens of thousands of run-hours, fuel-flexible (gas / H₂ / biogas), simple to mass-produce and scale.
- The thick electrolyte adds resistance, but the very high temperature recovers the efficiency — the trade Bloom tunes for 24/7 baseload at 99.999% reliability.
- The cost is heavy insulation and slow ramp-up/down.
- GE Vernova = metal-supported (MS-SOFC)
- thermally sprays thin anode, electrolyte (zirconium oxide), and cathode layers evenly onto a metal support (based on GE's 2011 SECA work + a March-2024 DOE project).
- metal conducts heat well and absorbs swings, enabling 600 °C operation and fast start/stop.
- but the thermal-expansion mismatch between the metal support and the ceramic electrolyte, plus support oxidation and long-run durability, remain hard unsolved problems,
- and spraying the micrometer-thick anode / electrolyte / cathode layers evenly onto the metal support is unproven at mass-production scale.
GEV isn't aiming at datacenter BTM.
- Its 600 °C, fast-cycling design suits a flexible source paired with its BWRX-300 SMR and carbon-capture roadmap
- and its real fuel-cell investment is SOEC for synthetic fuel (CO₂ + water → syngas via nuclear heat), not 24/7 datacenter power.
- Management's own timeline is 12–24 months to commercialize + 24–36 to industrialize (~36–60 months total), which it called "very ambitious."
Bloom's moat is time and data.
- Bloom took 12+ years to push stack durability from ~1 year to 5+ — across 22,000+ servers, 1M+ stacks, 40+ TWh delivered, and ~4.5 trillion field data points (each stack with a digital twin).
- A new entrant must walk the same curve; even optimistically, reaching customer-grade reliability is a 5–7-year journey.
- Net read: Bloom should hold ~80%+ of the datacenter-scale SOFC market through the late 2020s
- GEV's entry is a 2030s SOEC/SMR story, not a near-term BTM threat.
6. The Numbers — How This Shows Up in Financials, and What the Market Expects
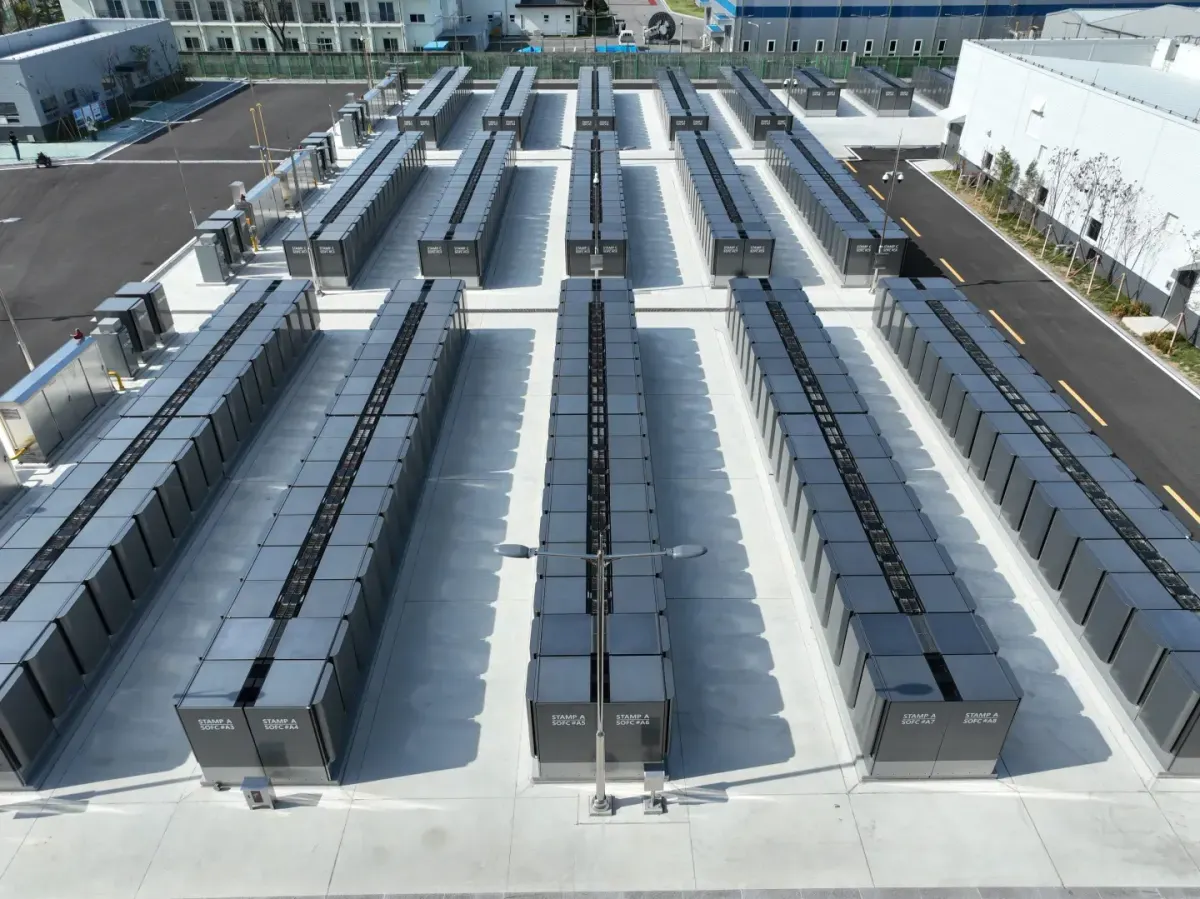
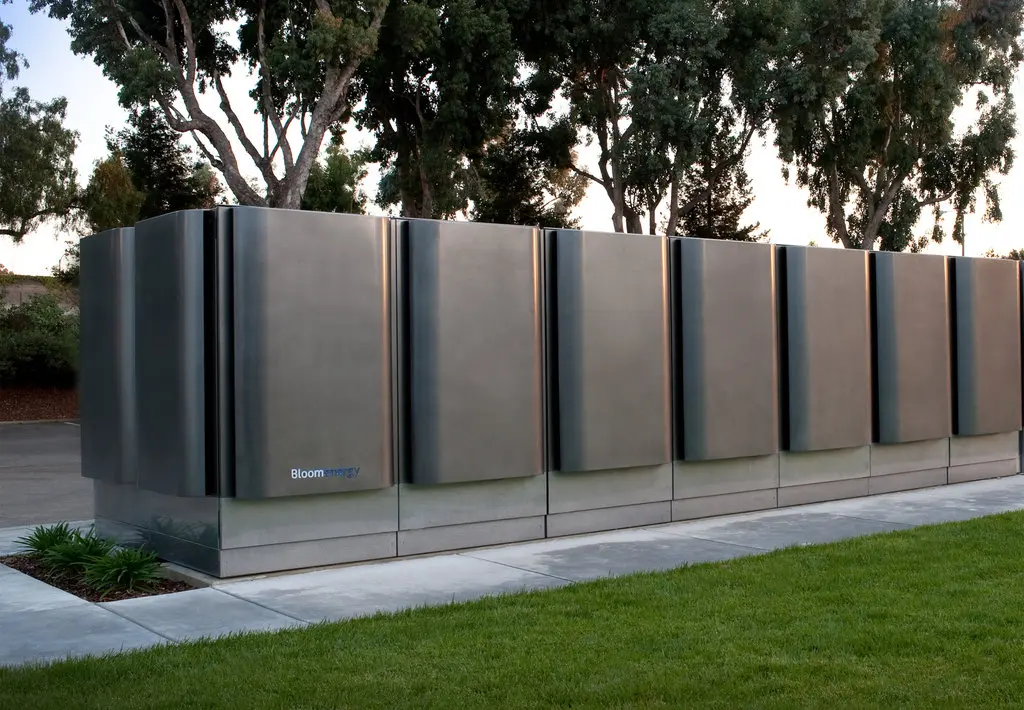
6.1 The business model — how Bloom makes money.
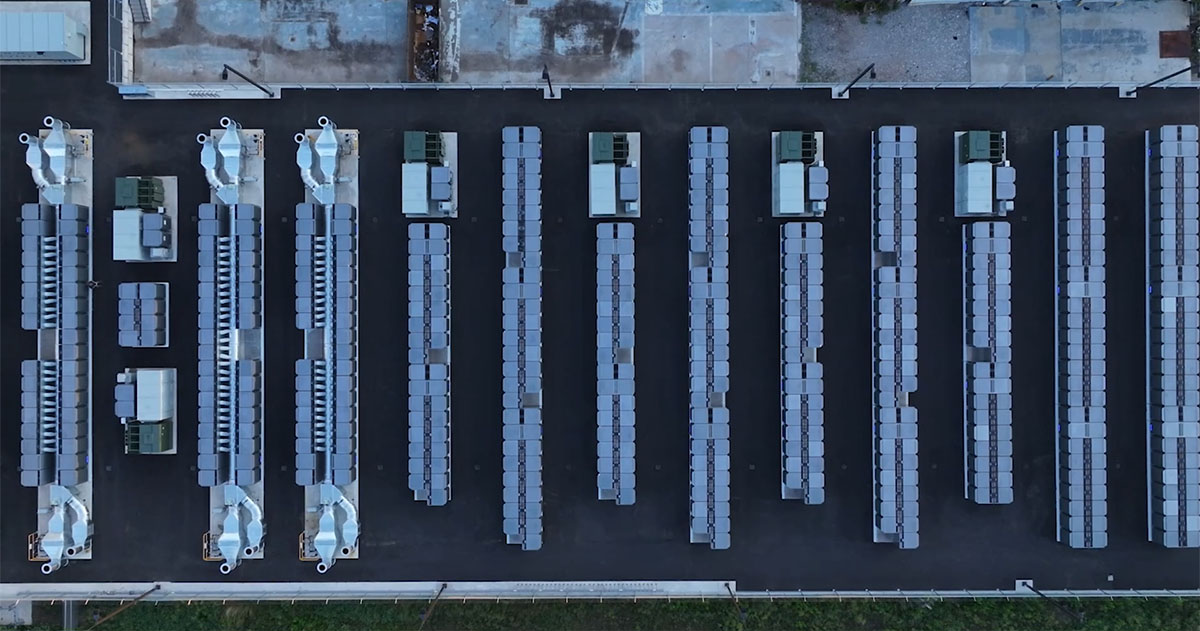
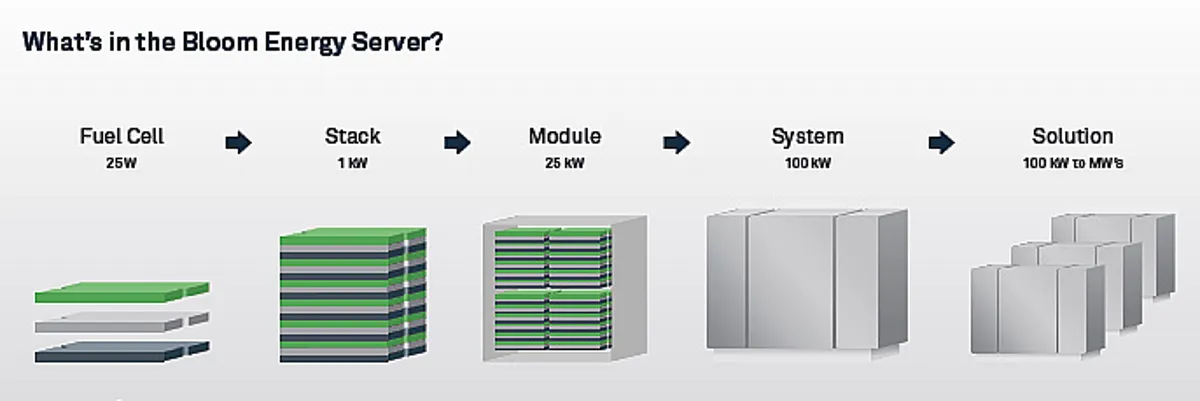
Bloom's solid-oxide fuel cell (SOFC) converts natural gas, biogas, or hydrogen to electricity without combustion — connect a gas pipeline and you have a power source almost anywhere, fast. The hardware scales modularly: cell → stack → module → Energy Server → power block (an "energy farm").
Revenue arrives in four streams (4Q '25 mix):
- Product (82% of revenue, +35% YoY) — Energy Server hardware, recognized one-time at sale.
- Installation (9%, +86%) — recognized one-time when Bloom does the install.
- Service (8%, +15%) — long-term O&M and monitoring on the installed base; the annuity layer.
- Electricity (1%, –5%) — power sold under PPAs (e.g. $99/MWh over 5 years).
The service flywheel is the durable-margin engine management keeps stressing:
- Every system sold attaches a 10–20-year service contract, so the installed base — and the recurring revenue under it — compounds.
- As Bloom accumulates SOFC-stack know-how, replacement and repair costs fall, lifting service gross margin over time.
- Reliability underwrites the pitch: Bloom cites ~99.995% annual uptime, giving an off-grid Energy Server grid-like frequency and power stability.
6.2 Bloom Energy financials
Income statement — GAAP actuals through 2025, consensus through 2027E:
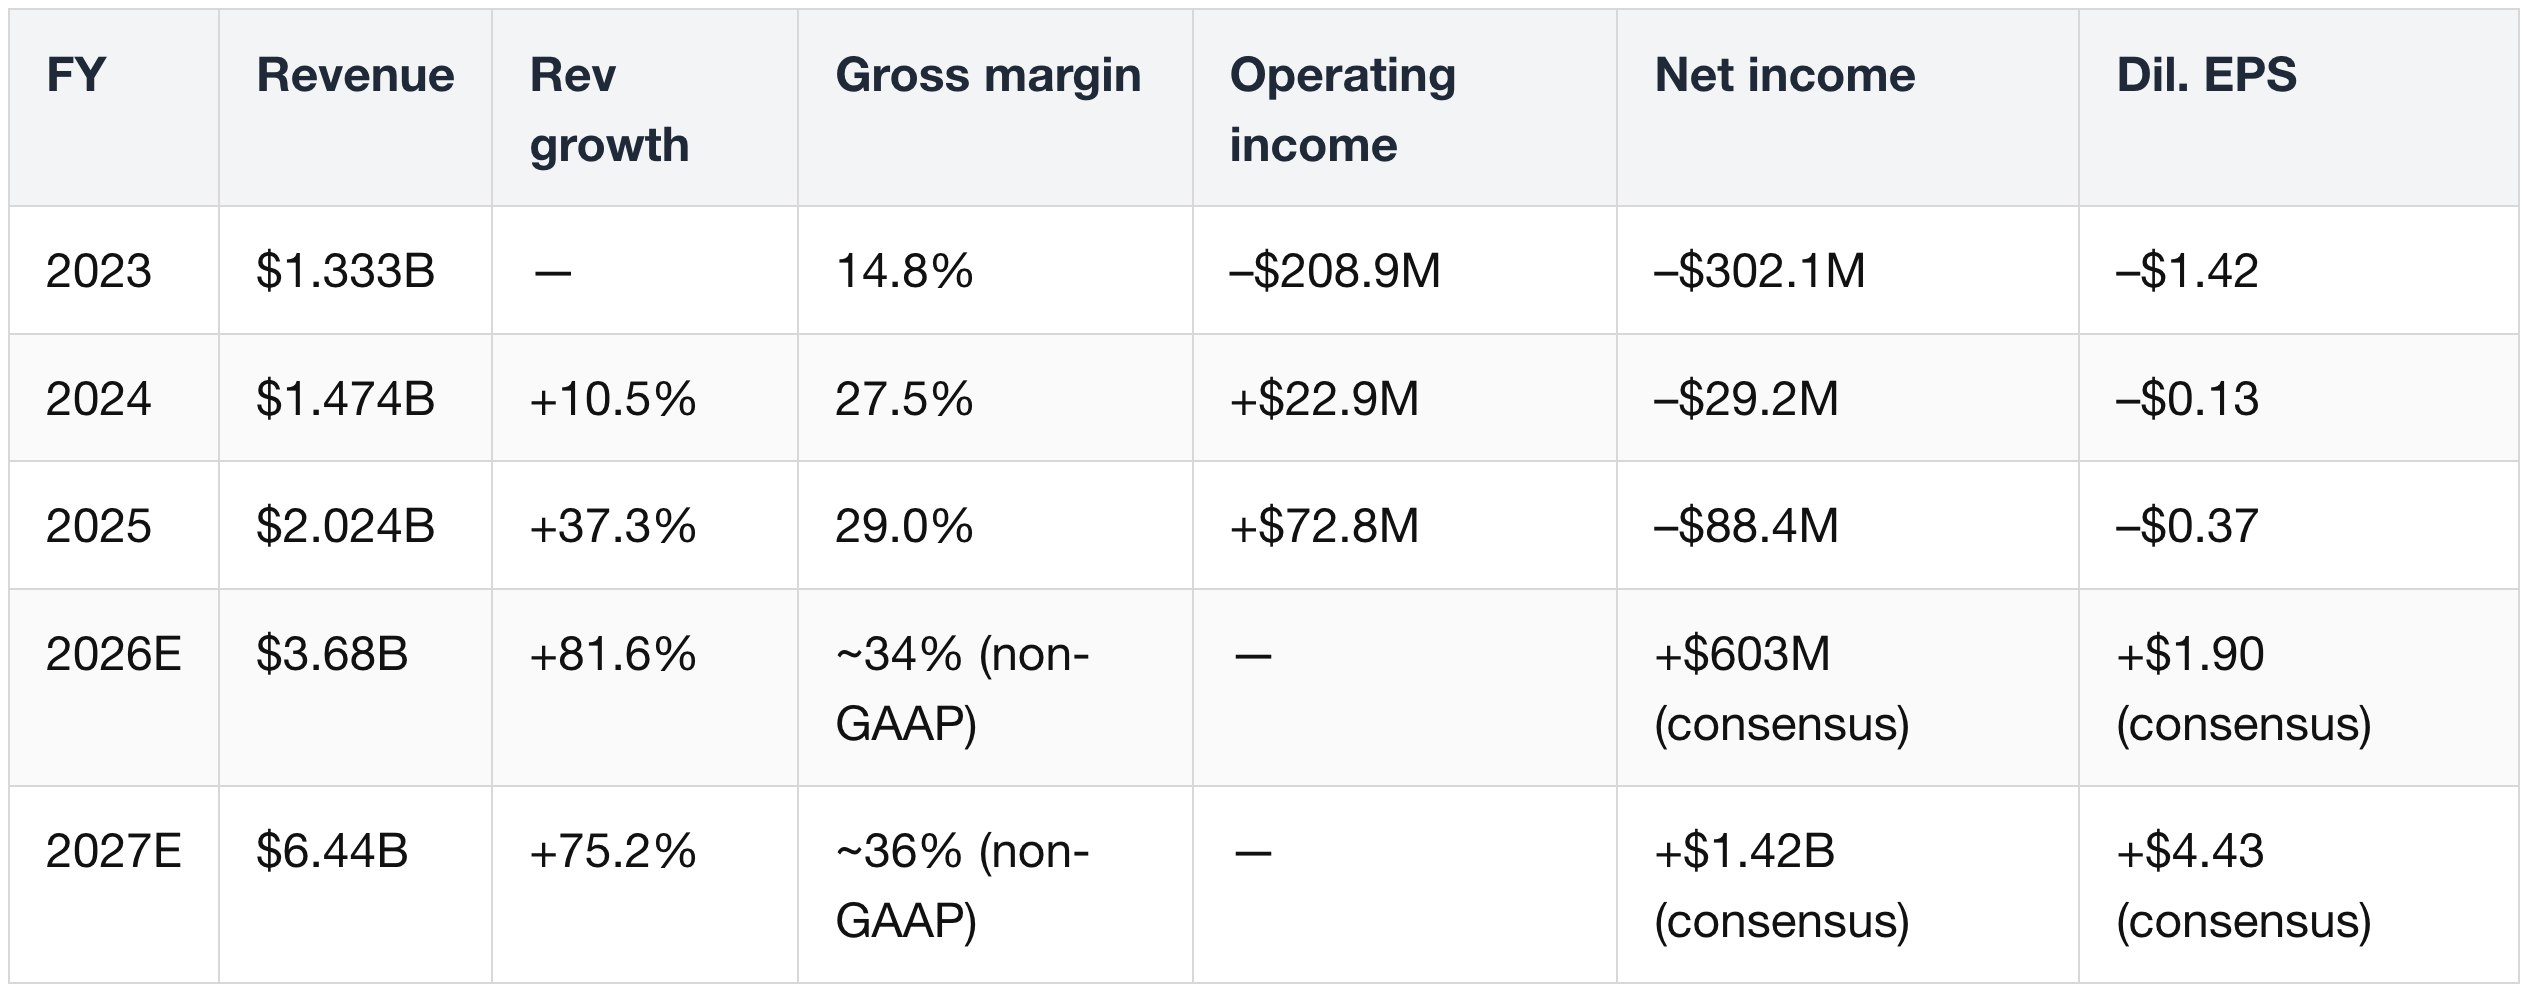
Forward EPS / net income are Street consensus on a non-GAAP basis; near-term GAAP net income remains pressured by the items noted below.
Quarterly inflection (GAAP):
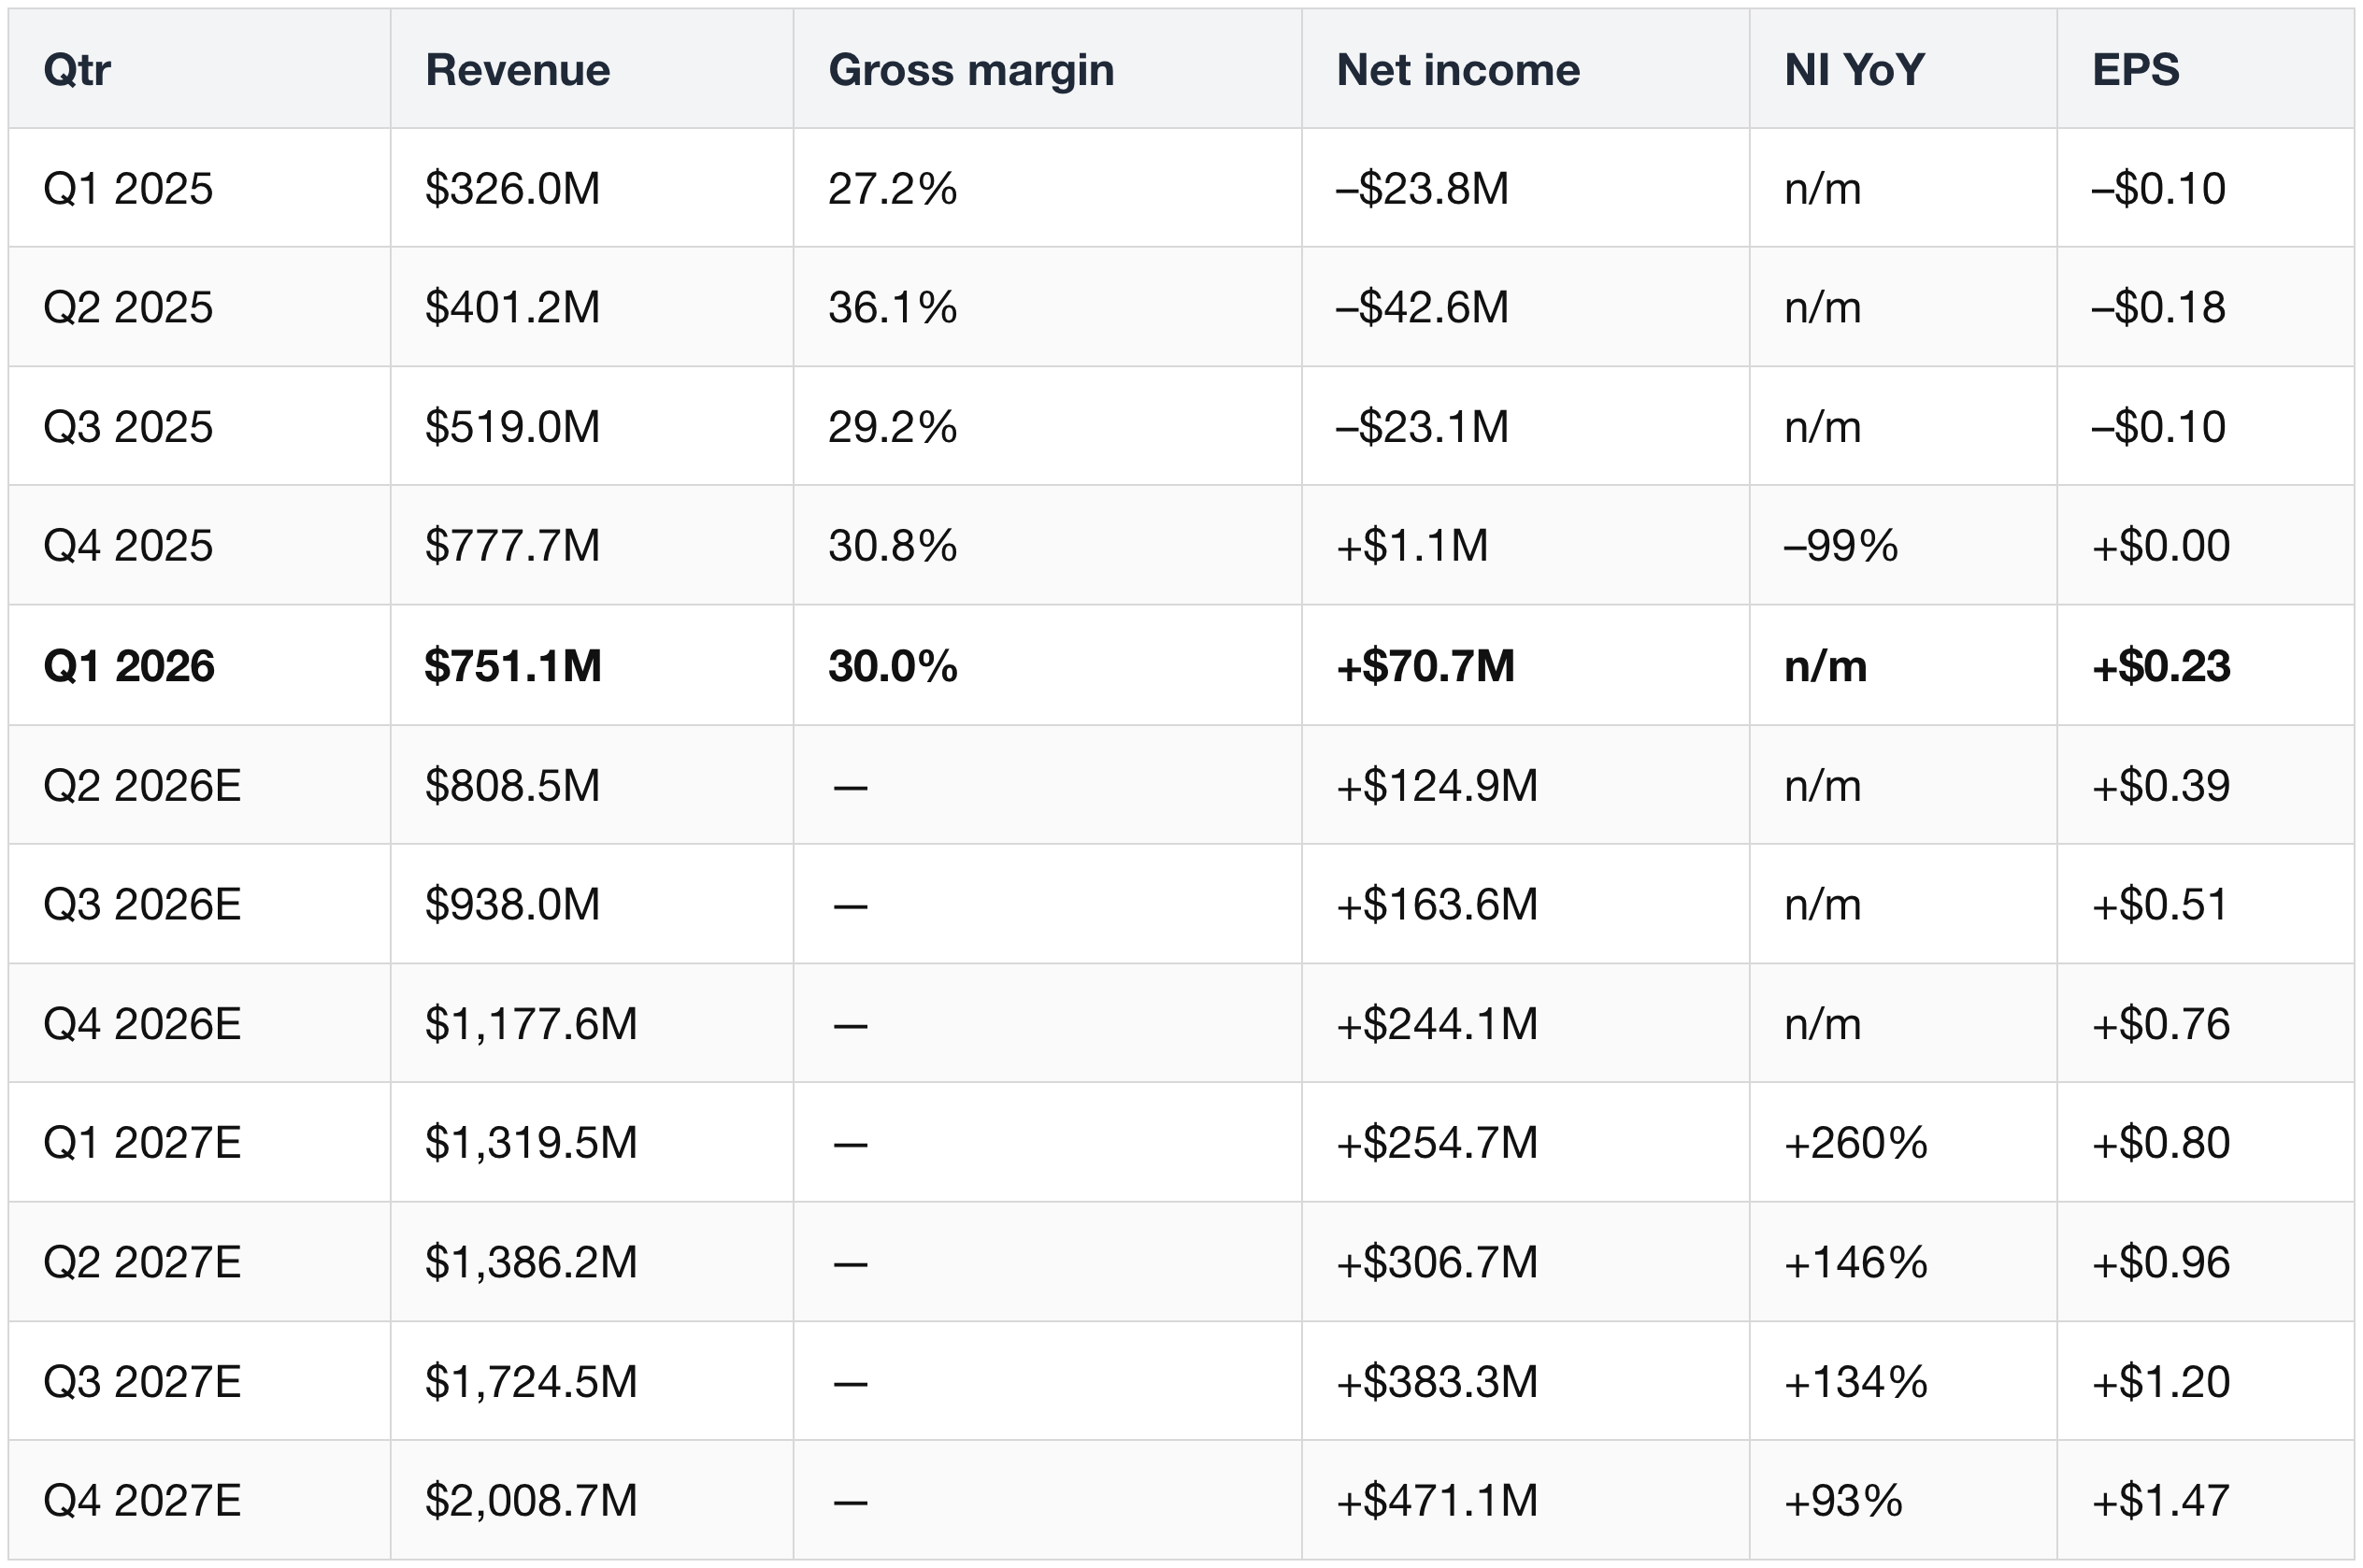
Q1 '25–Q1 '26 are GAAP actuals; Q2 '26E onward are Street consensus on a non-GAAP basis.
- Q1 '26 (+130% YoY) is the inflection — the first clean GAAP-profitable quarter, datacenter-product-driven.
- GAAP-vs-non-GAAP nuance: FY '25 carried +$72.8M GAAP operating income but a –$88.4M GAAP net loss (due to interest on ~$2.8B debt, warrant mark-to-market, non-controlling interests).
Quarterly balance sheet (Q1 '25–Q1 '26):
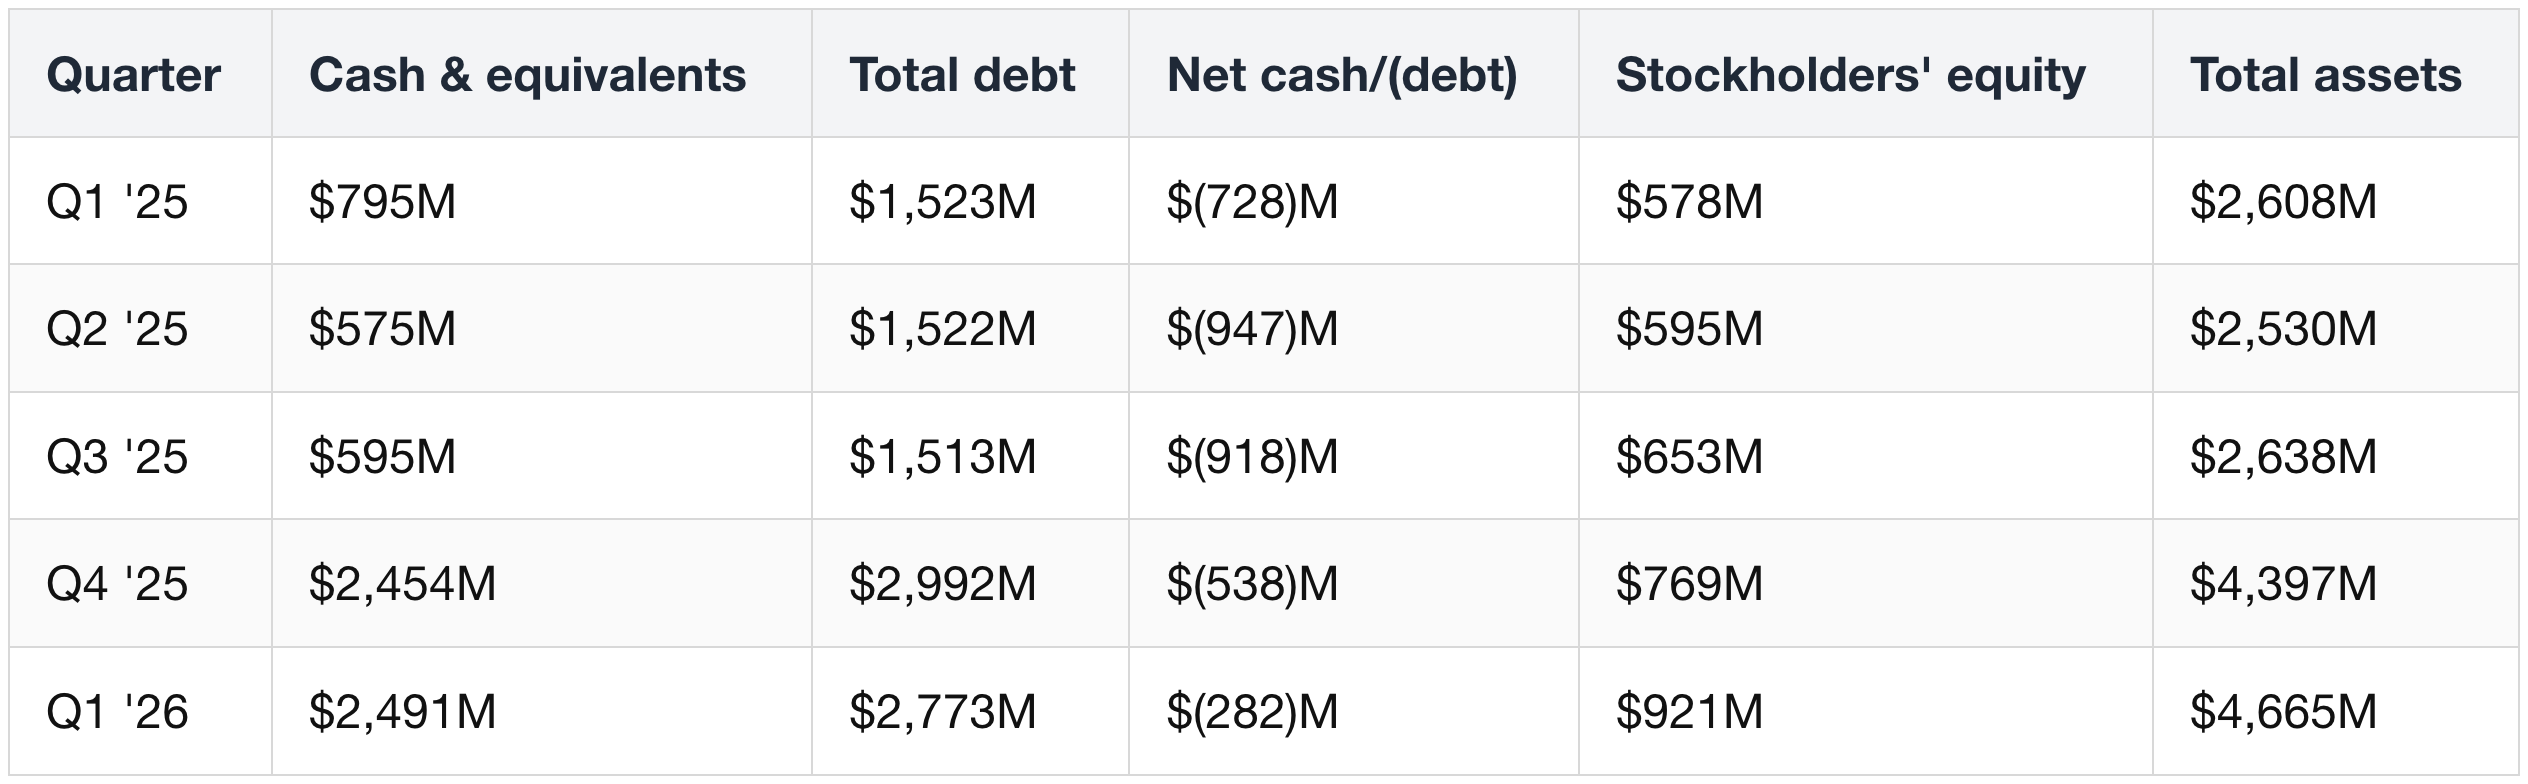
- The Q4 '25 step-up — cash from ~$0.8B to ~$2.5B and debt from ~$1.5B to ~$3.0B — is a ~$1.5B convertible-note raise to pre-fund the capacity ramp.
- Net debt has since improved (–$918M in Q3 '25 → –$282M in Q1 '26) as equity builds toward ~$0.9B.
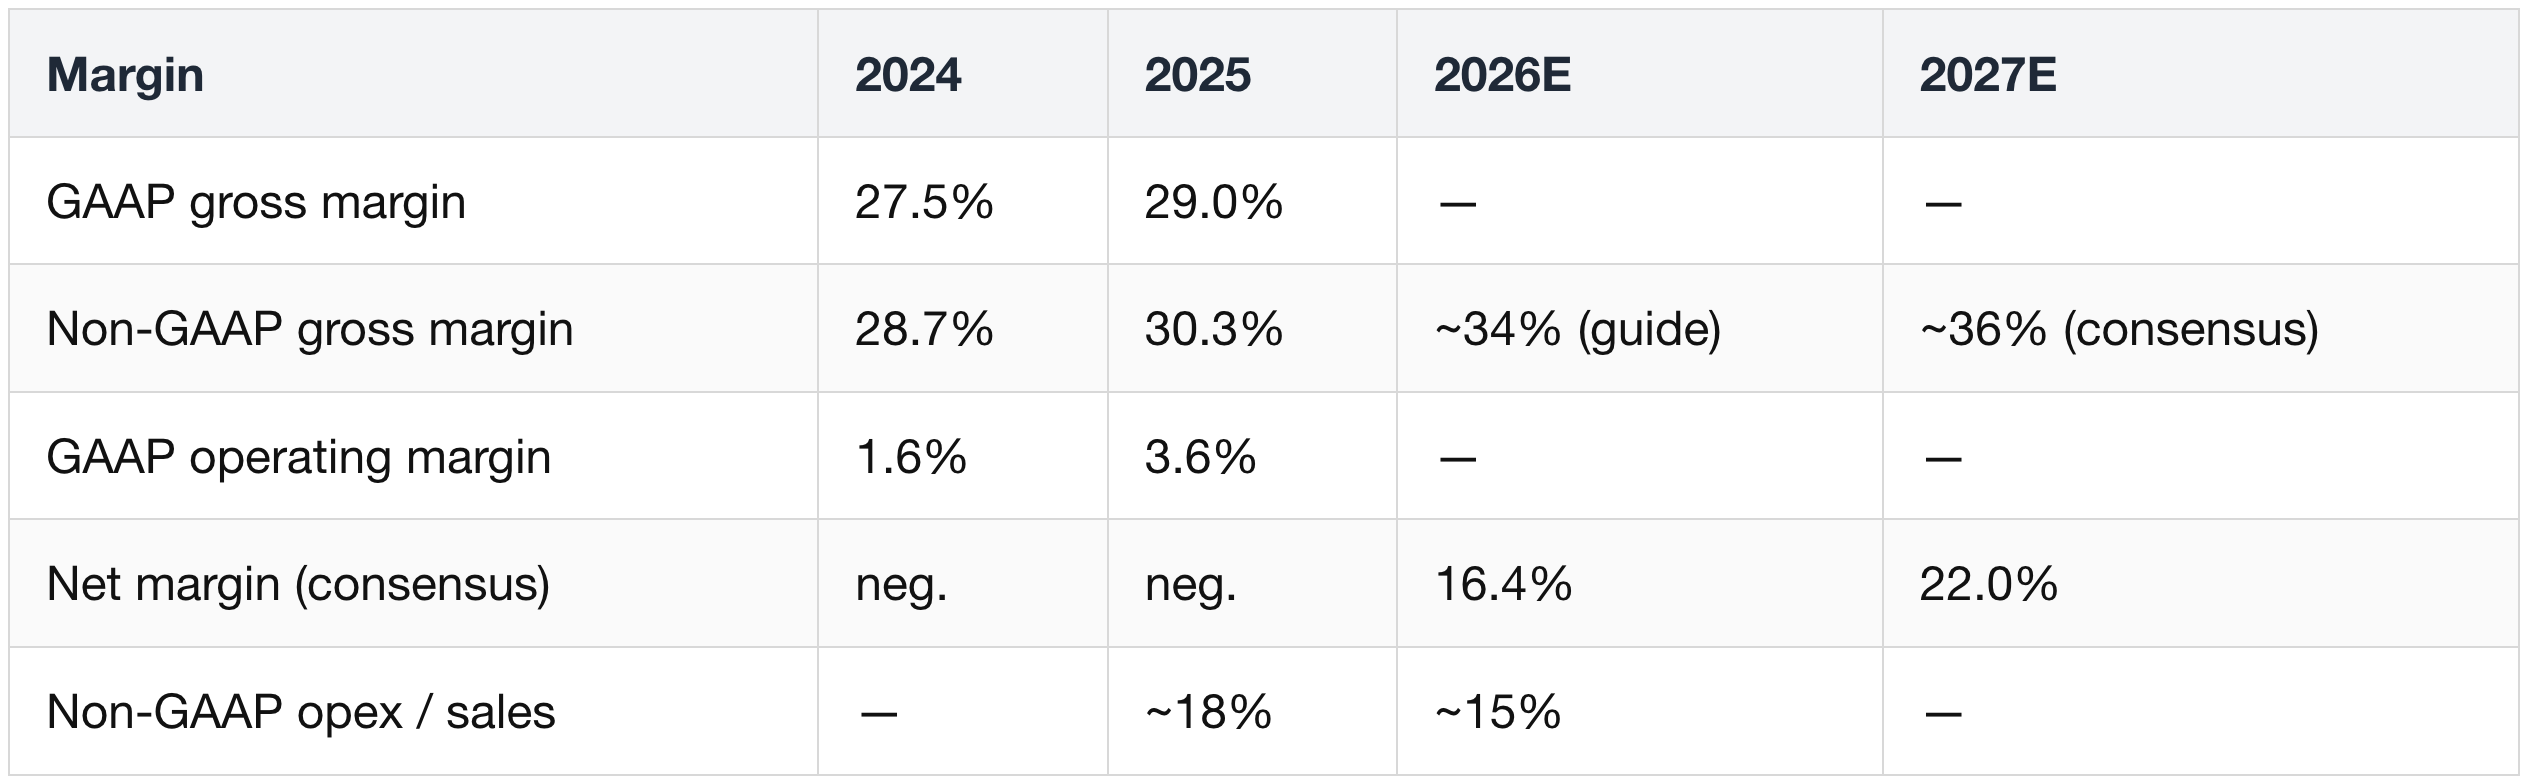
Margin trajectory:
Product vs. service gross margin (the operating-leverage + annuity story):
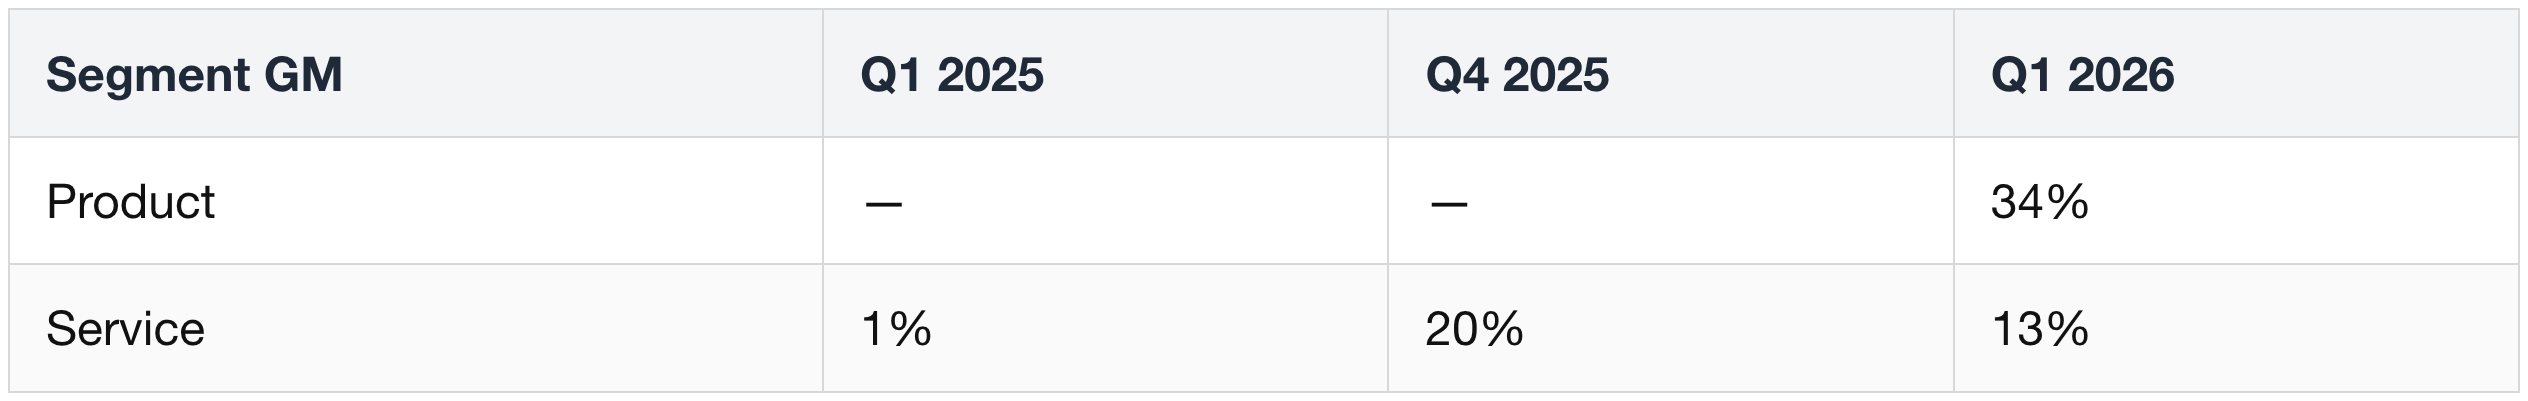
- The Service segment has now strung together eight consecutive profitable quarters; with a 100% attach rate and 10–15-year contracts, it is the annuity engine sitting under the $14B service backlog.
- A $19.7M warranty reserve (estimated liability Bloom Energy sets aside to cover future warranty costs on sold Energy Server systems pending installation; it is recorded as part of product costs) hit Q1 '26 product COGS — a quality datapoint to monitor as volume scales.
- Profit leverage is the story: Q4 '25 net margin was ~8.7% (excluding a one-time convertible-bond charge); the street assumes NIM climbing to ~22% by CY27
Capacity is capital-light — and the history proves it:
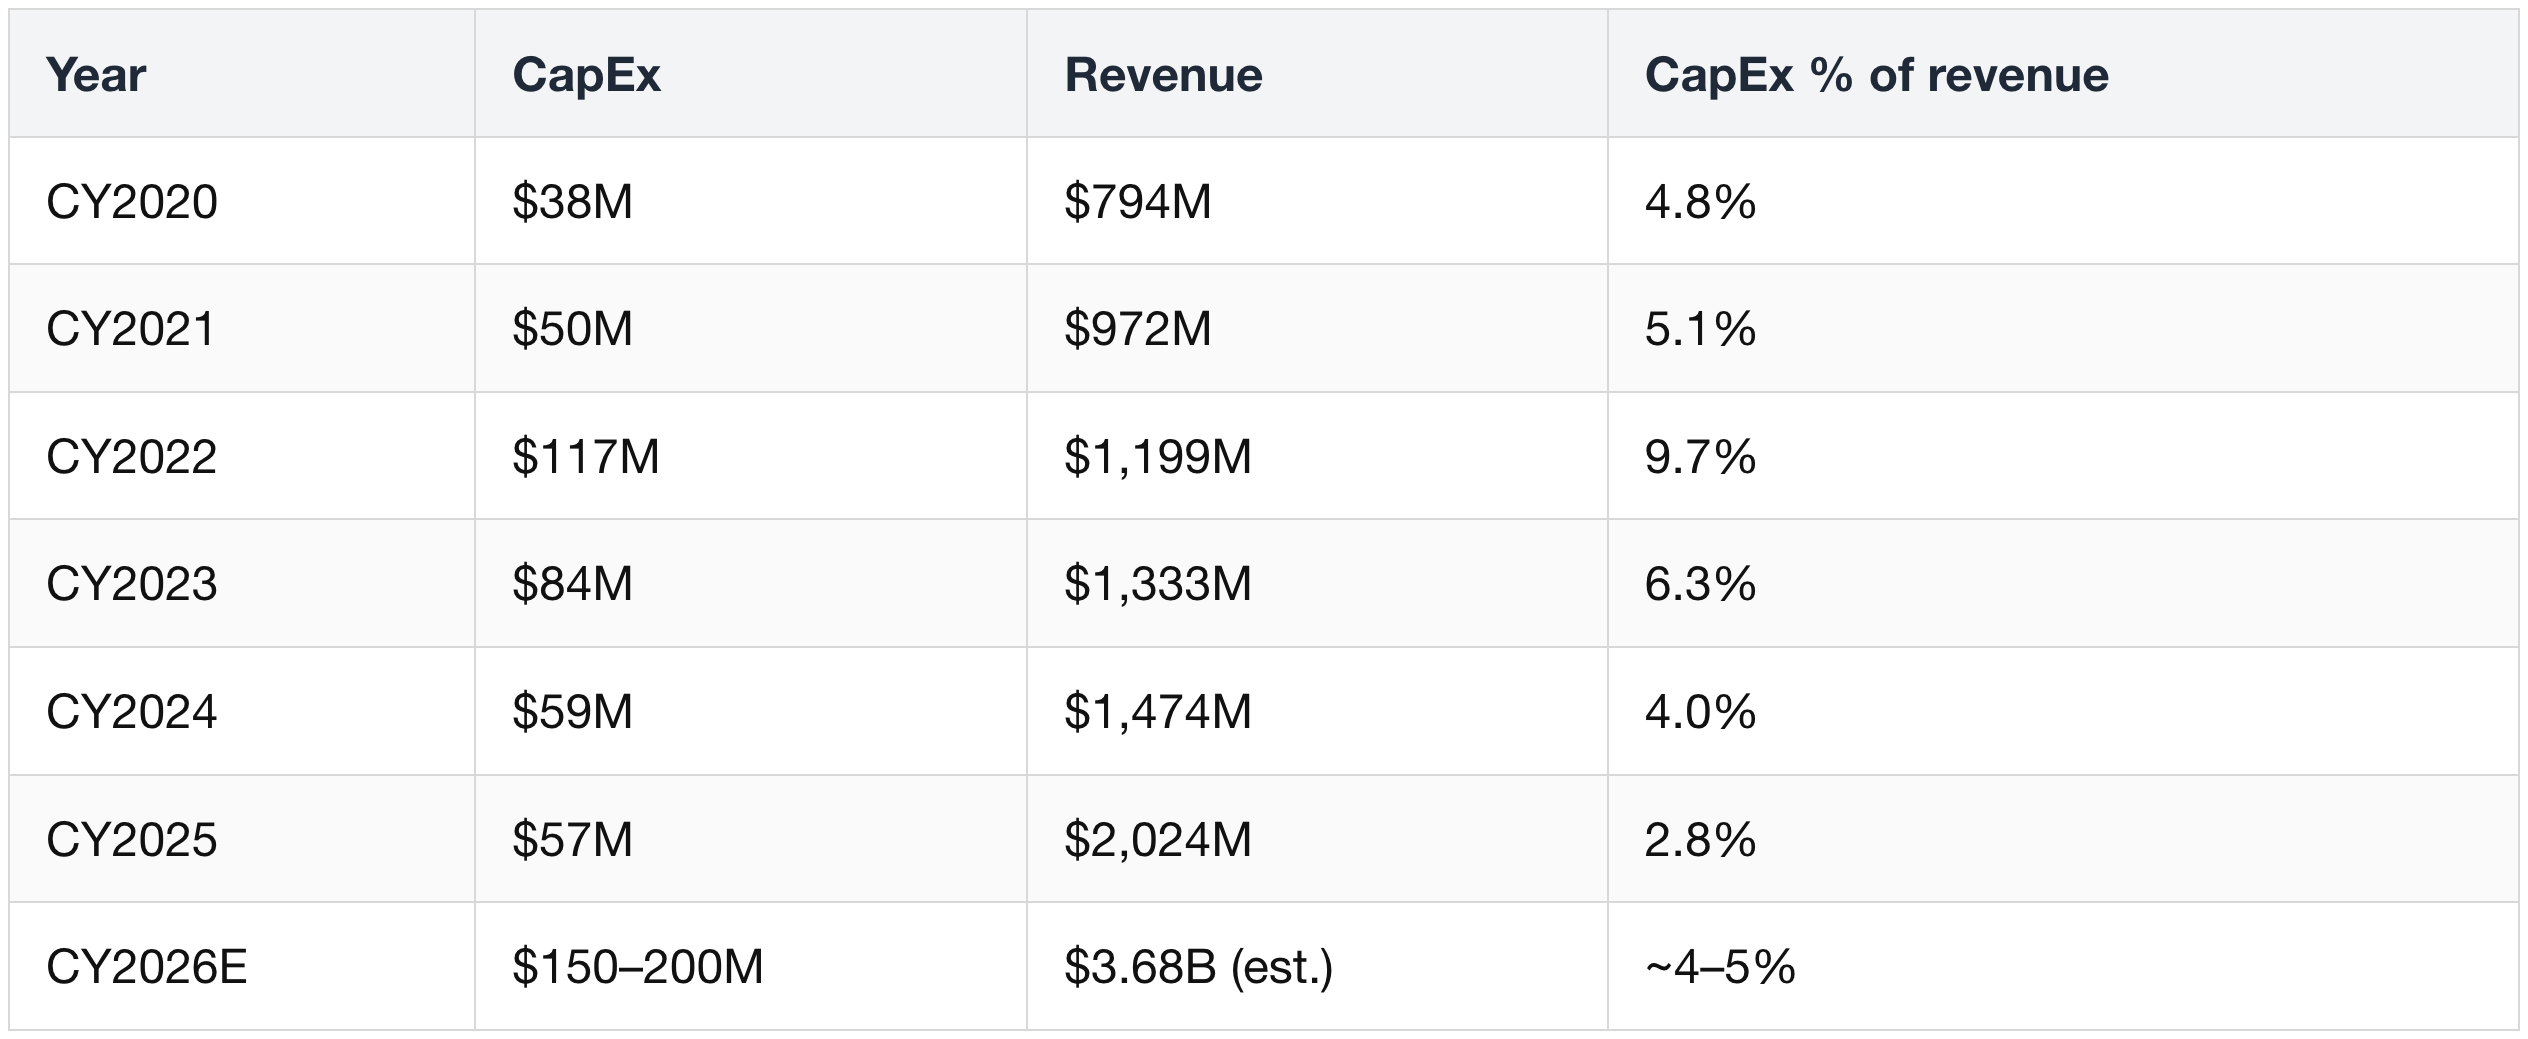
- Bloom scaled revenue from ~$0.8B to ~$2.0B while spending under $120M of CapEx in any single year — and CapEx has fallen as a share of revenue, to just 2.8% in CY25.
- Fremont runs at ~1 GW today and can be qualified to 5 GW. Management guides CY26 CapEx of $150–200M to triple nameplate to 3 GW — a step-up in dollars, but still only ~4–5% of revenue, with payback measured in months, not years.
6.3 Backlog & the Oracle anchor
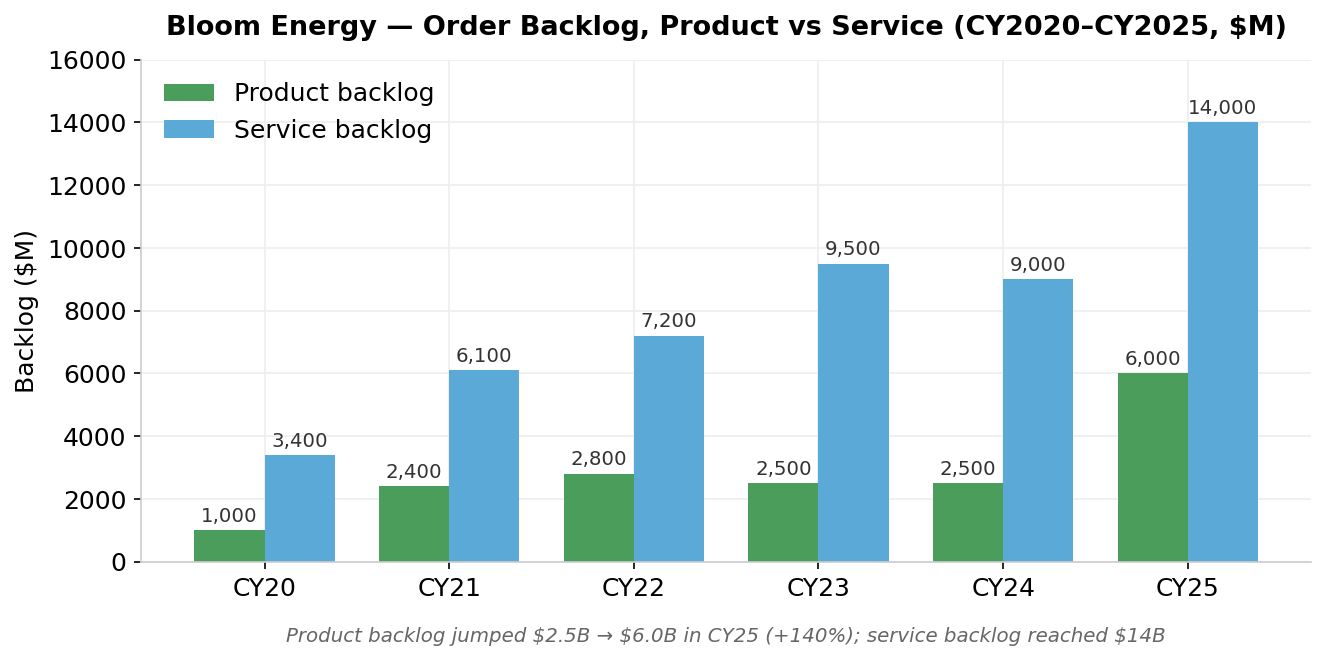
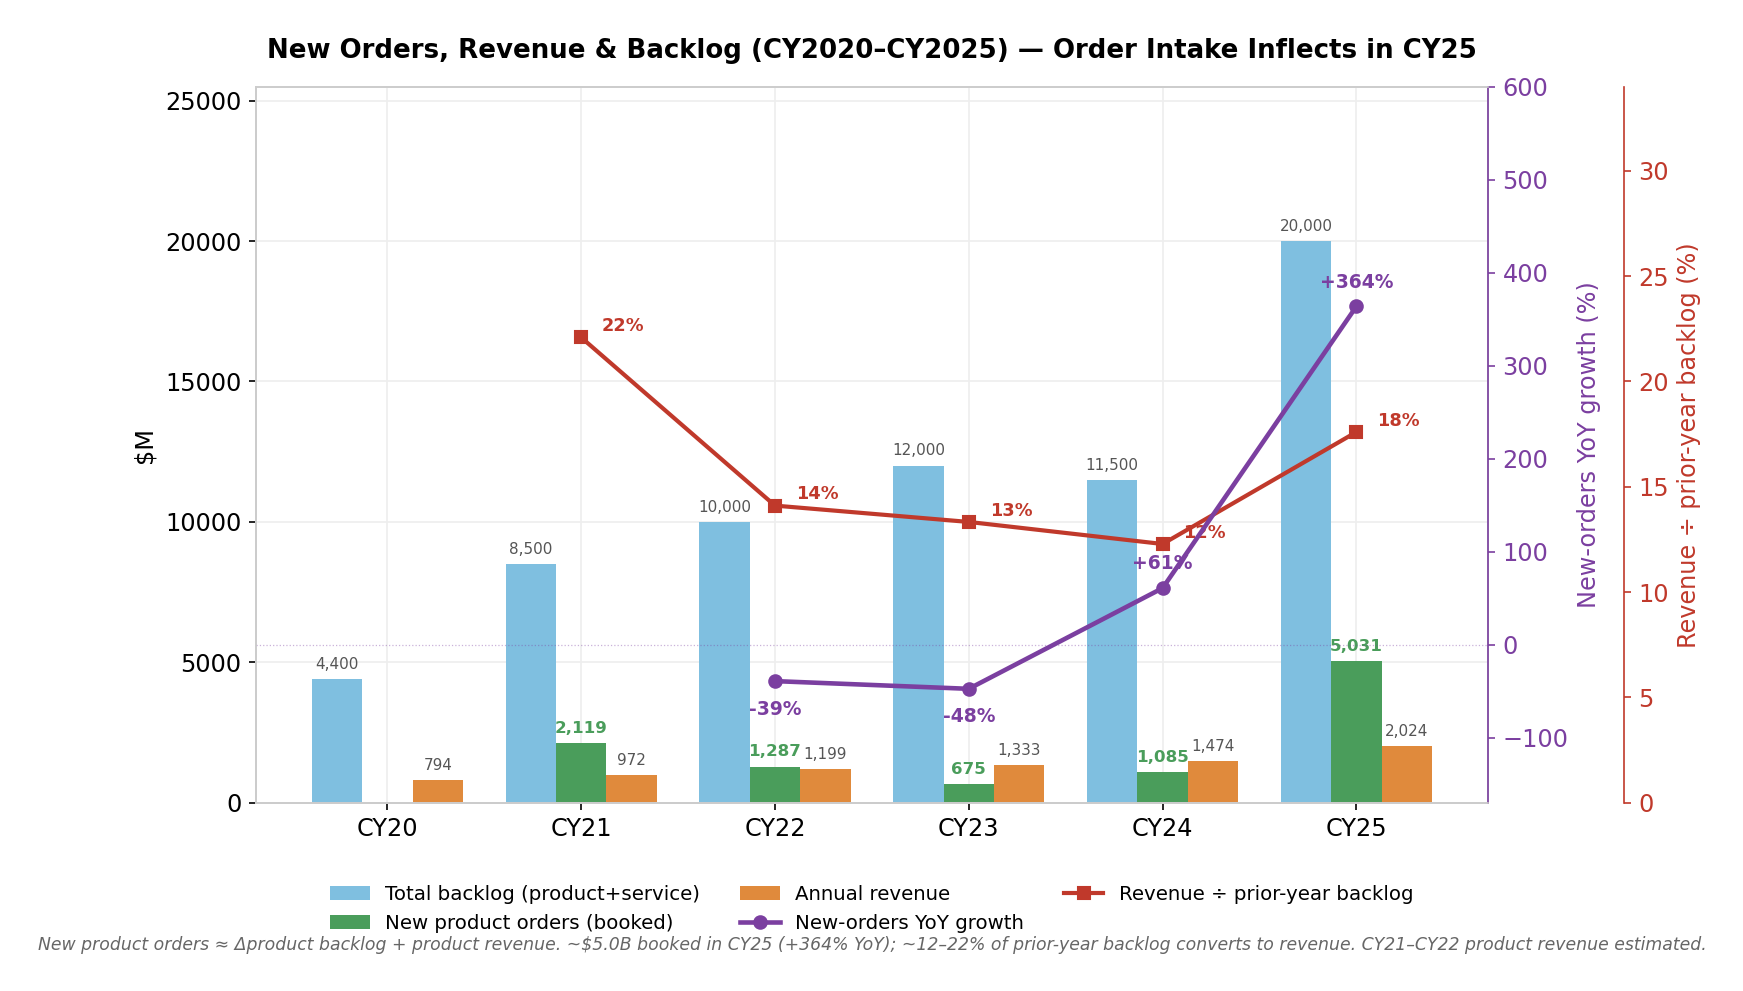
- Product backlog more than doubled: $2.5B (end-CY24) → $6.0B (end-CY25), +140%. Service backlog reached ~$14B.
- What that implies about order intake. Bloom updates its product backlog only once a year (in Q4), so you back into new orders.
- Product backlog rose from $2.5B to $6.0B even after ~$1.5B of product revenue was recognized and shipped out of it during 2025.
- So gross new product orders in 2025 = $6.0B − ($2.5B − $1.5B) = ~$5.0B booked — roughly 5× the ~$1.1B of product orders booked in CY24.
- And $6.0B understates it.
- It excludes the Hedgehog and Yellowbox SOFC projects (applications filed Jan–Feb 2026),
- which is why 2026 revenue could land at $4–5B versus the ~$3.3B guide.
- If 2026 order intake merely doubles again, product backlog exits 2026 near ~$16B.
- Oracle MSA: up to 2.8 GW.
- 1.2 GW contracted (2026–27) ≈ $4B product/install + $40–50M/yr service;
- the remaining 1.6 GW is optional with no binding schedule — the single highest-leverage variable in the model.
- >50% of datacenter product backlog is non-Oracle. Per Bloom's 4Q '25 call, its data-center SOFC customers went from 1 a year ago to 6 by Q4 '25.
- Five hyperscalers (Oracle, AWS, and three unnamed) plus the neocloud CoreWeave.
- Bloom's broader named-customer set since adds Nebius's $2.6B / 328 MW deal, AEP's 1 GW utility offtake, Equinix, and CoreSite.
- Over two-thirds of commercial-and-industrial revenue is repeat, and the US product backlog has flipped to 80%+ from low-power-cost states — versus two years ago, when 80%+ sat in high-cost regions (California, the Northeast) — evidence the value proposition is reliability and speed, not energy arbitrage.
- Oracle warrant (what it means):
- To win the deal, Bloom granted Oracle the right to buy 3.53M Bloom shares at $113.28 each, a warrant worth $261.3M when issued.
- In the accounts Bloom treats that $261.3M as a reduction of the revenue it recognizes from Oracle (a customer incentive), not a cash expense. The strike was set near the market price — relative to other multi-GW contracts, the effective discount/share dilution is modest.
- Brookfield framework (what it means):
- Brookfield (a large infrastructure investor) committed a $5B framework to finance Bloom-powered projects.
- Brookfield supplies the capital to build and own the fuel-cell plants, so a customer can buy power without funding the equipment upfront, while Bloom still books the hardware sale.
- Management called it "a great start and a pilot" (Bloom Energy management — Q1 '26 earnings call, Apr 2026) — an early, scalable template for off-balance-sheet project financing, not yet a large committed figure.
6.4 Valuation & what the market expects
Spot (2026-06-09):
- $255.30; 52-wk range $20.93–$322.83.
- Market cap $72.6B
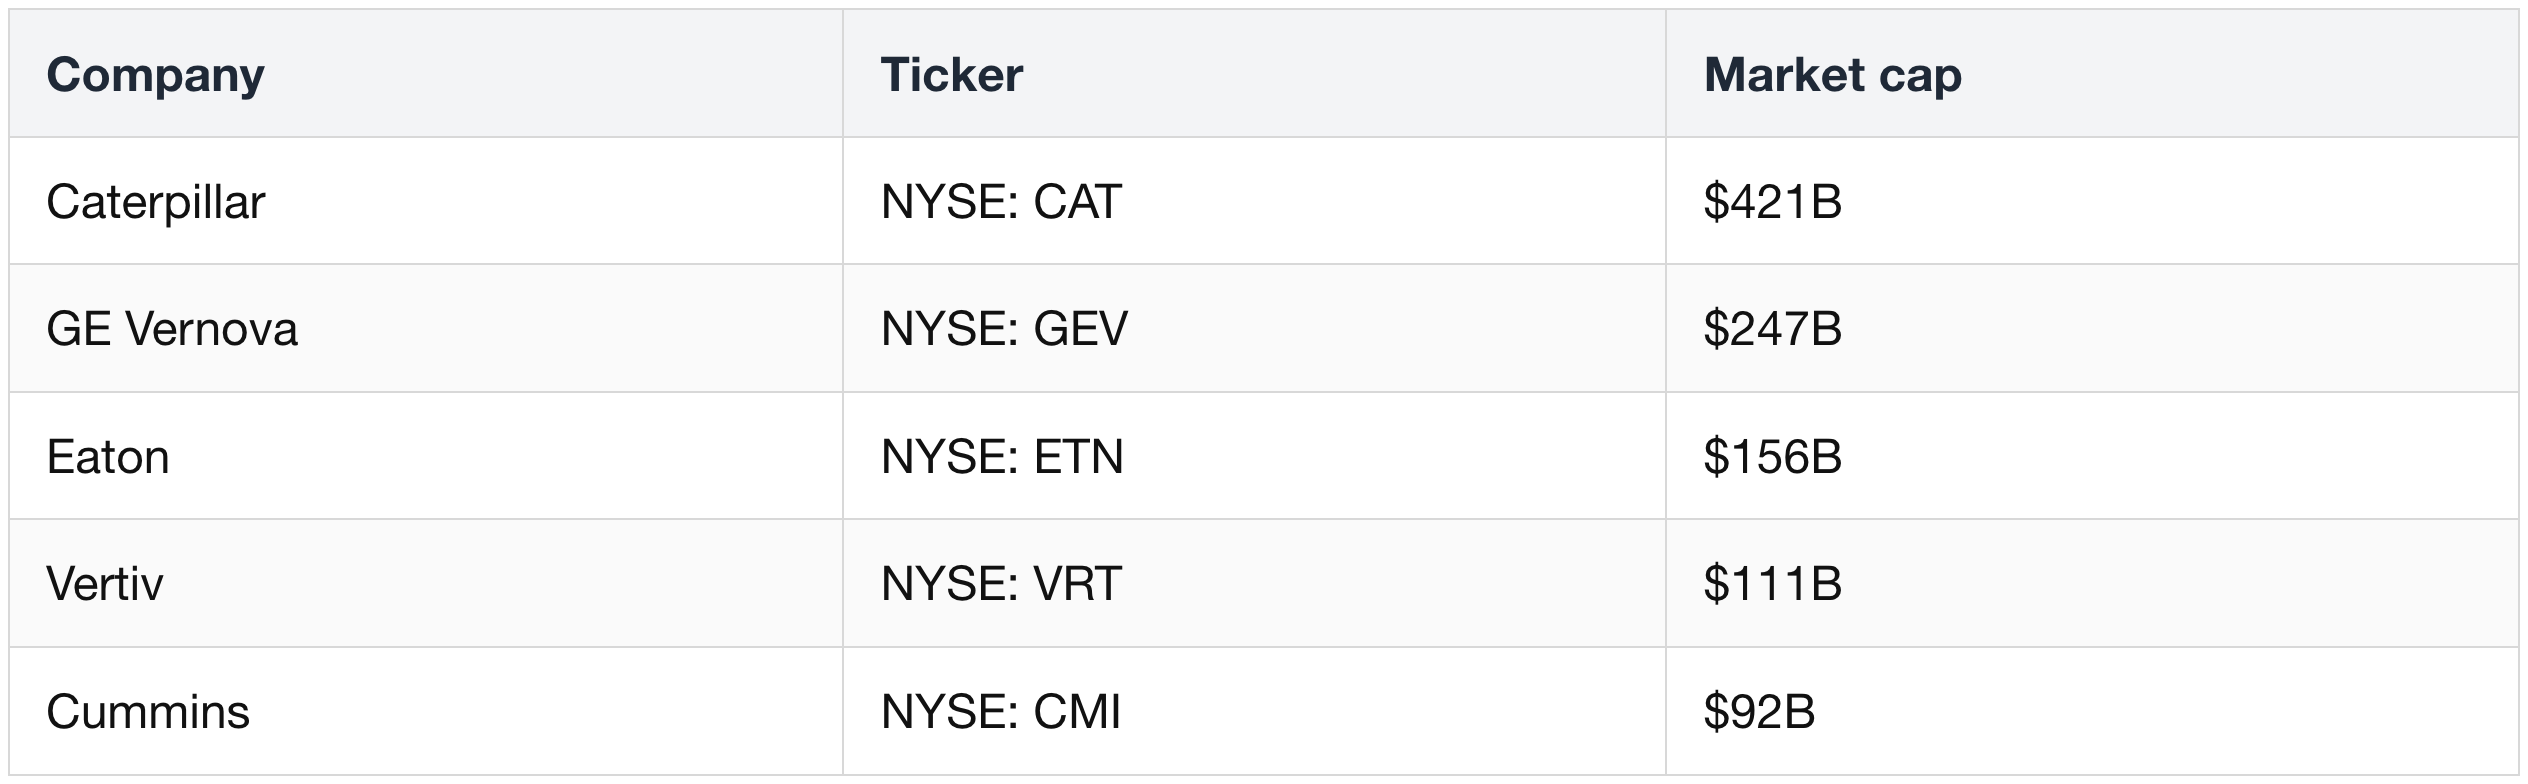
Peer scale by market cap. Bloom sits between two camps — the turbine/electrical-equipment incumbents that dwarf it, and the fuel-cell pure-plays it dwarfs:
Turbine & electrical-equipment providers:
Fuel-cell & power-conversion providers:
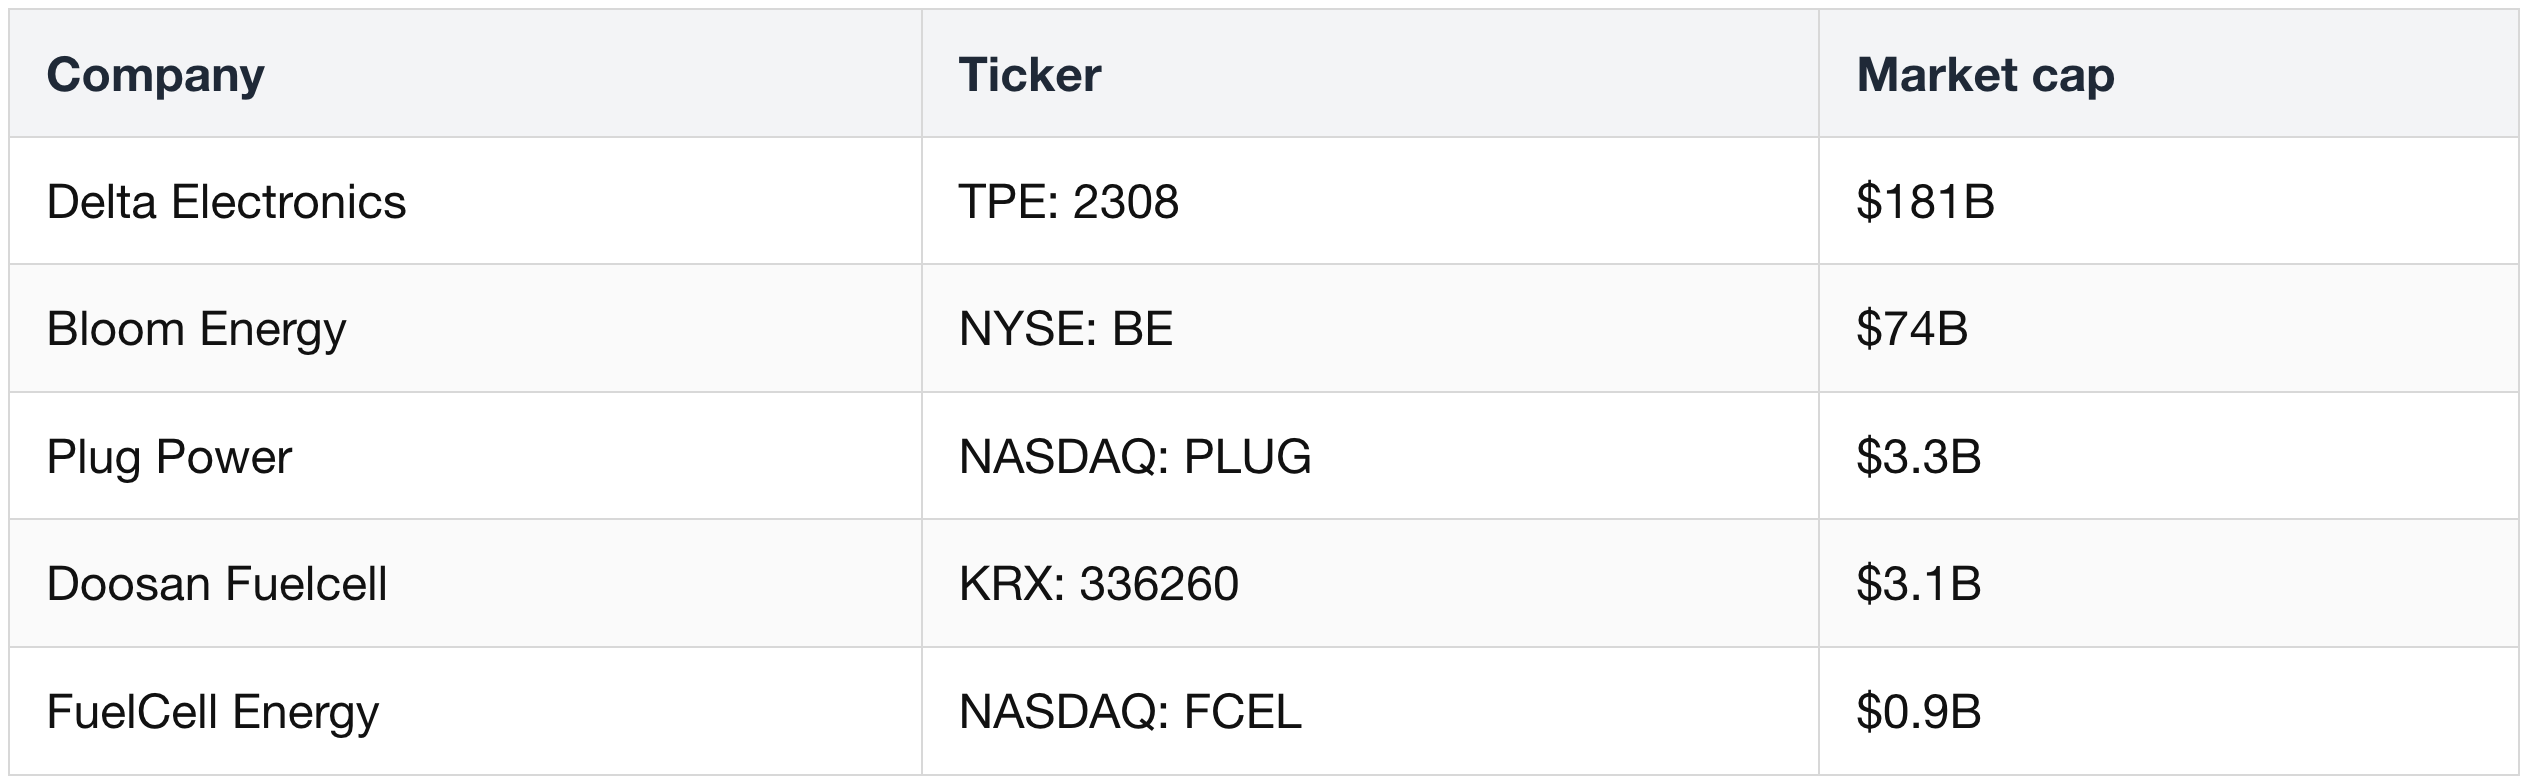
- Among dedicated fuel-cell names, Bloom ($75B) is the clear leader — roughly 20× Plug Power and Doosan Fuelcell and ~80× FuelCell Energy.
- (Delta Electronics is far larger at ~$186B, but it's a diversified power-electronics group, not a fuel-cell pure-play. Doosan Fuelcell and Delta are converted from KRW/TWD at spot.)
Forward multiples (priced at $255.30, on consensus non-GAAP EPS):
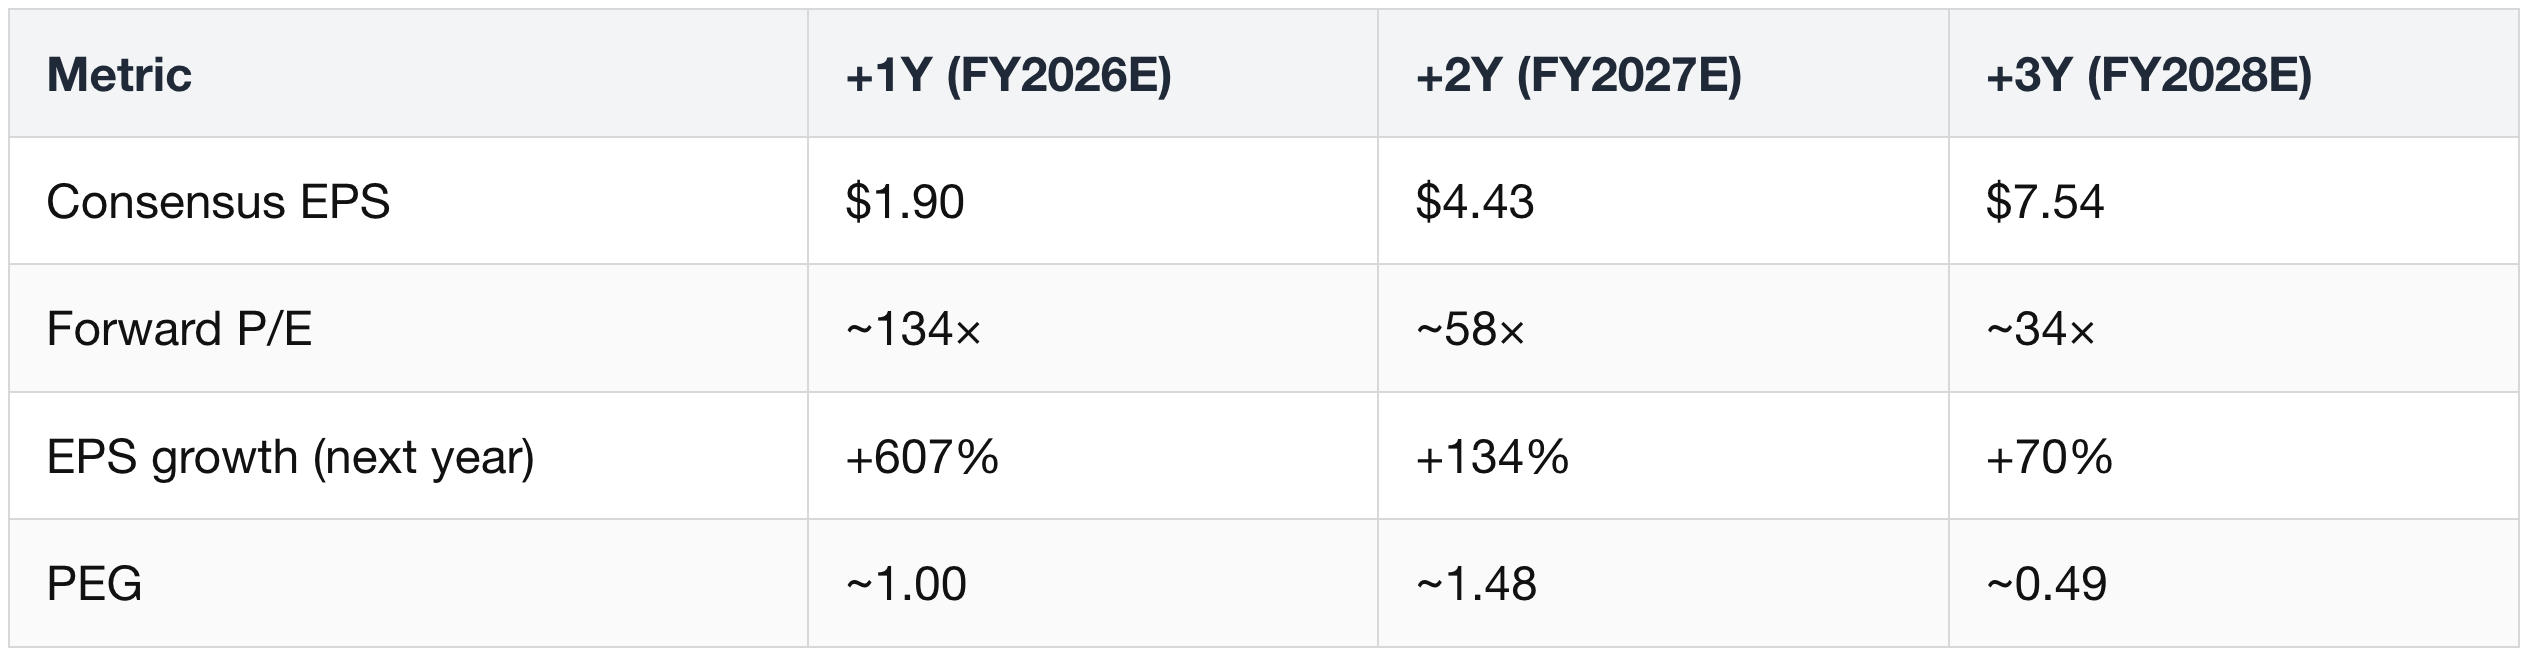
- The headline ~134× NTM multiple is the number bears quote — but it compresses to ~58× one year out and ~34× by FY2028E on the steep earnings ramp, with the PEG dropping below 1 by then.
- The +1Y PEG of ~1.0 says the multiple is "reasonable relative to growth" if the consensus EPS trajectory (>600% then +134%) is actually delivered.
- That conditional is the whole debate: the valuation is not irrational, it is fully dependent on flawless two-year execution.
Diversified sell-side view (targets are as-published; the stock now sits above most):
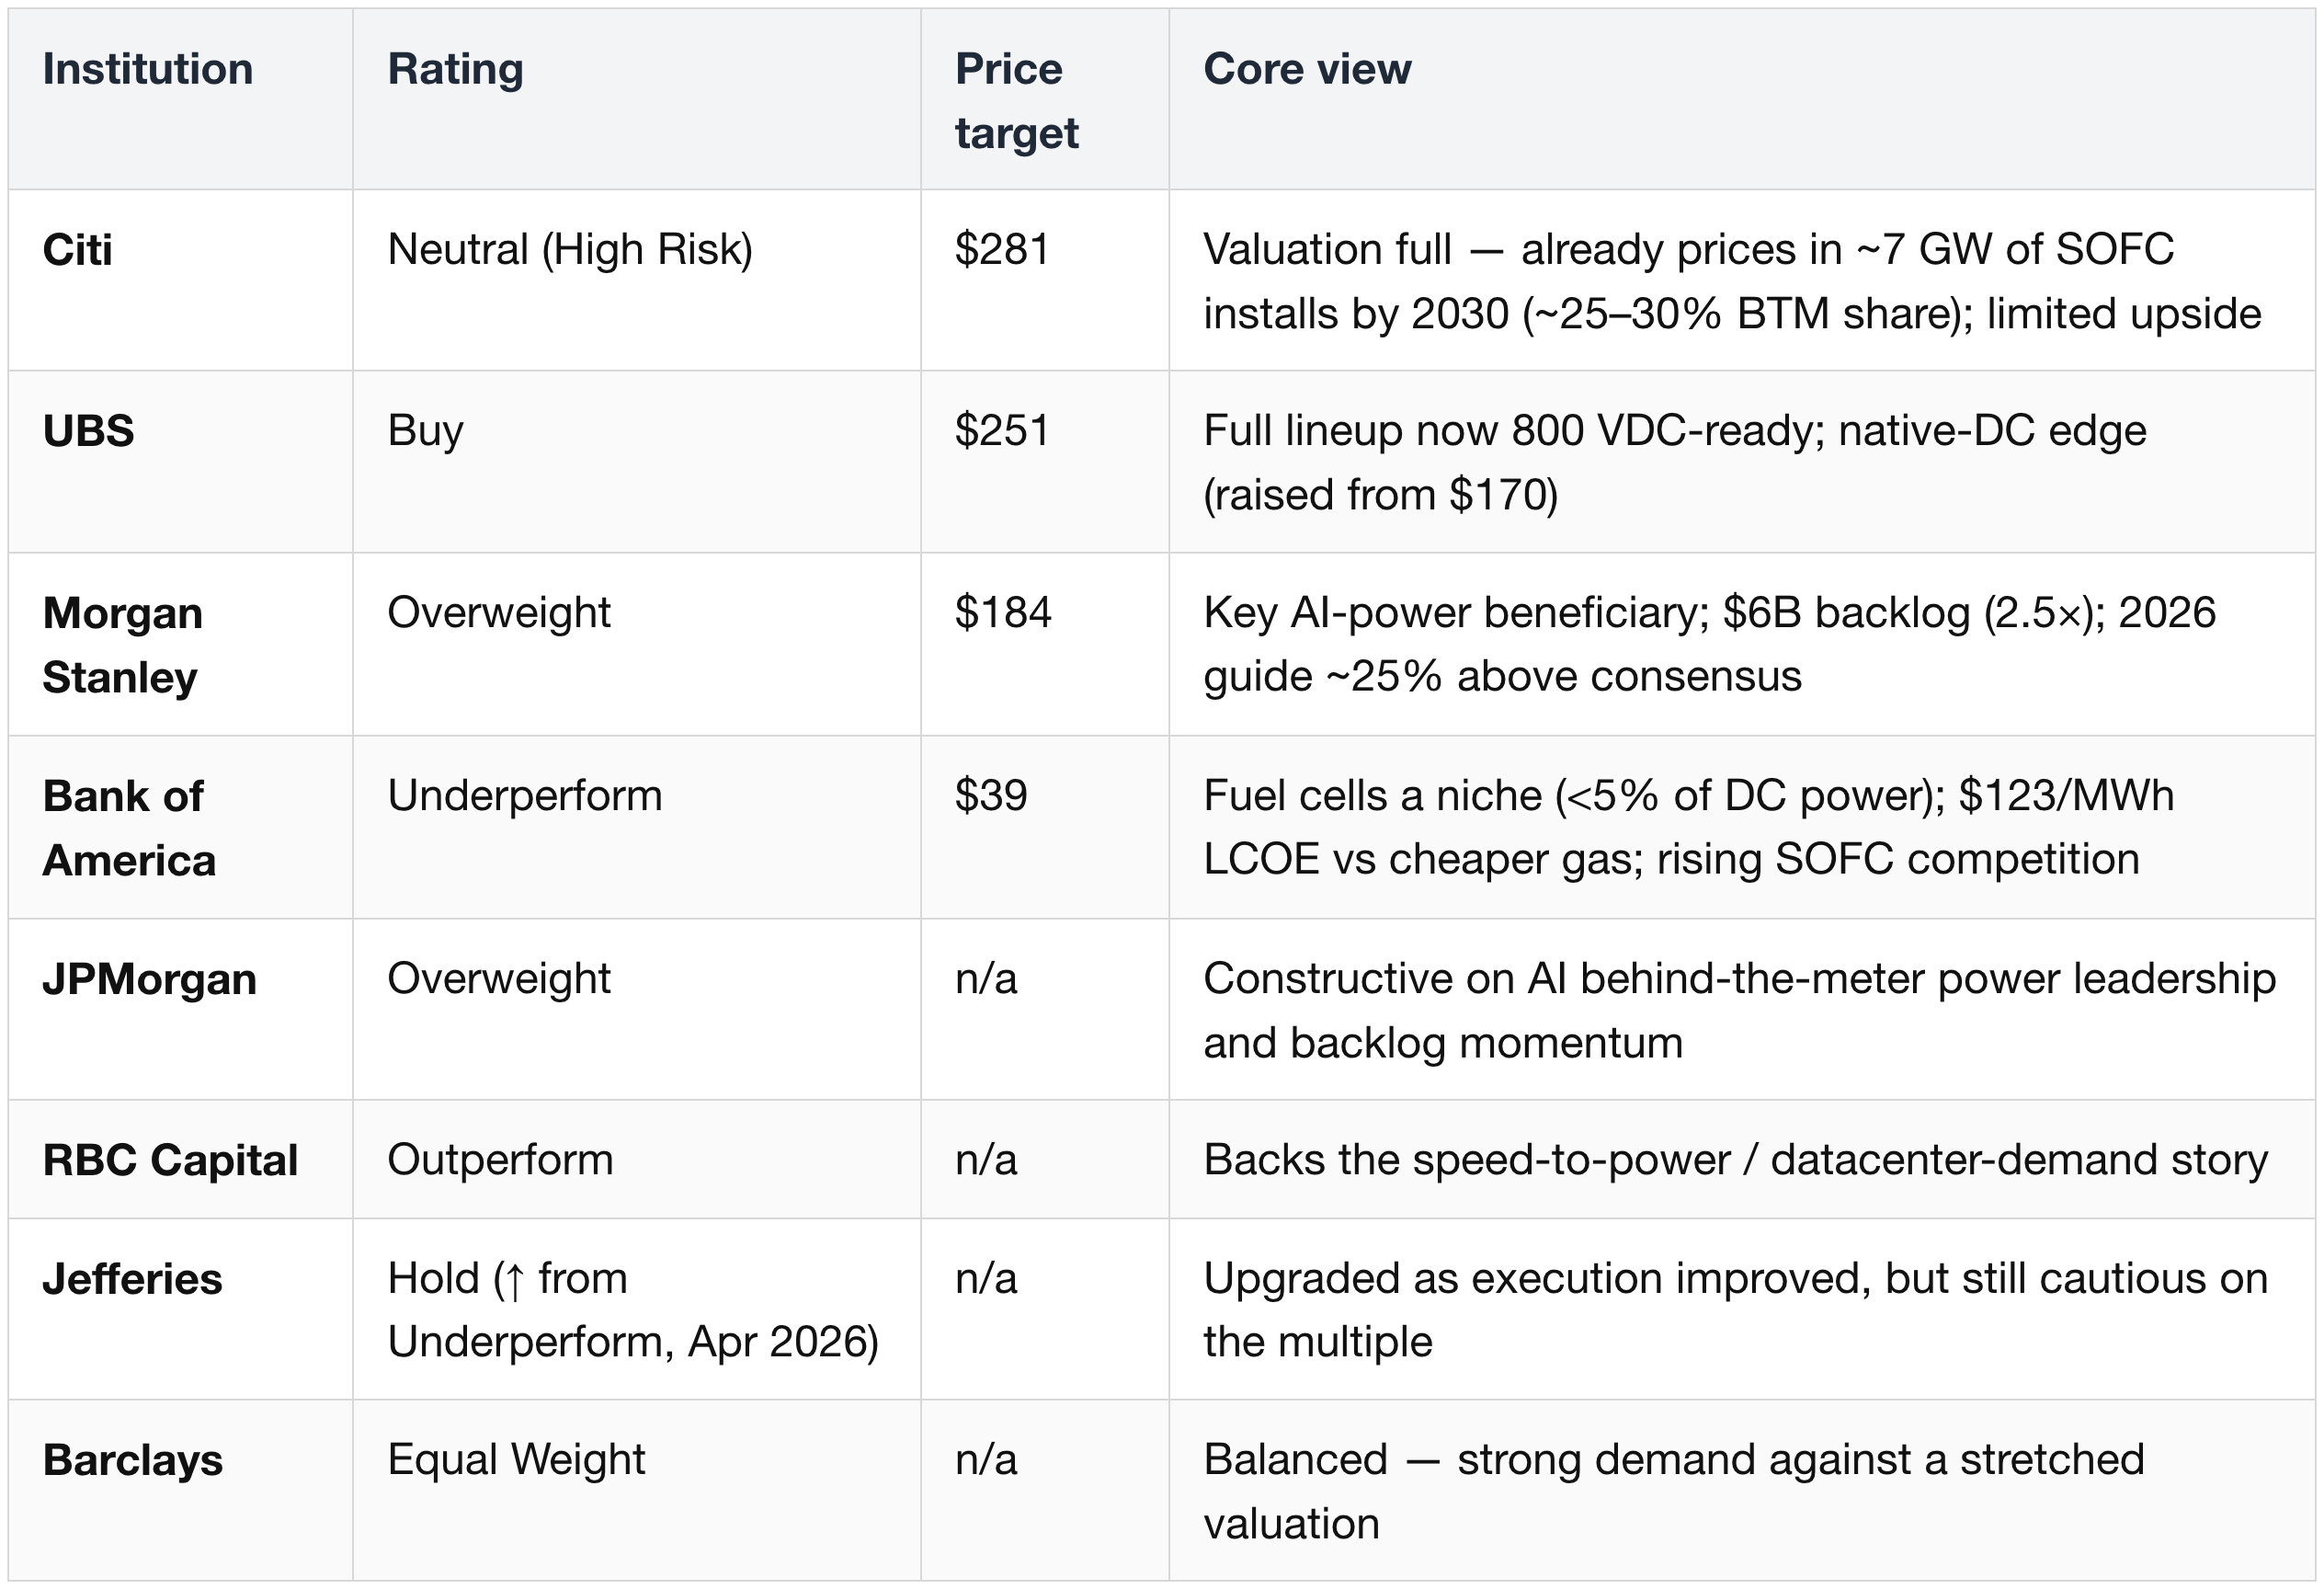
- Rows are sorted by published price target, high to low; firms without a formally published target follow. Ratings are current 2026 actions. The broader tape also carries Susquehanna (Positive), Baird (Outperform), Wells Fargo (Equal Weight), and Mizuho (Neutral).
- The highest target ($281) belongs to Citi — but on a Neutral rating, where the number reflects valuation math rather than a buy call.
- BofA's $39 Underperform sits at the bottom; between them the desk leans Overweight/Outperform (UBS, Morgan Stanley, JPMorgan, RBC), with BofA the lone major bear.
- The divergence is about the scalability and competitive durability of Bloom's platform, not its near-term momentum.
6.5 The assumptions-based price target (the bull-case chain)
A cleaner way to size the upside is the explicit chain of assumptions behind the bull case — each link feeding the next:
- Capacity ramp: product shipments 0.5 GW (3Q '25 TTM) → 1.2 GW (CY26E) → 2.7 GW (CY27E), as Fremont scales from ~0.5 GW utilized toward 3 GW.
- Revenue: ~$4B (CY26E) → ~$9B (CY27E) — above the Street's $3.68B / $6.44B.
- Margin: consolidated GPM in the low-30s% (ramp inefficiency at 0.5/1.0 GW utilization), NPM rising to 19% by CY27 → CY27 net income ≈ $1.71B.
- Multiple: with EPS CAGR assumed >50% and a fair-value PEG of 1.0, the implied target P/E ≈ 50×.
- CY27 target: $1.71B × 50 = ~$85.5B market cap → ~$363.83/share (on ~235M fully-diluted shares).
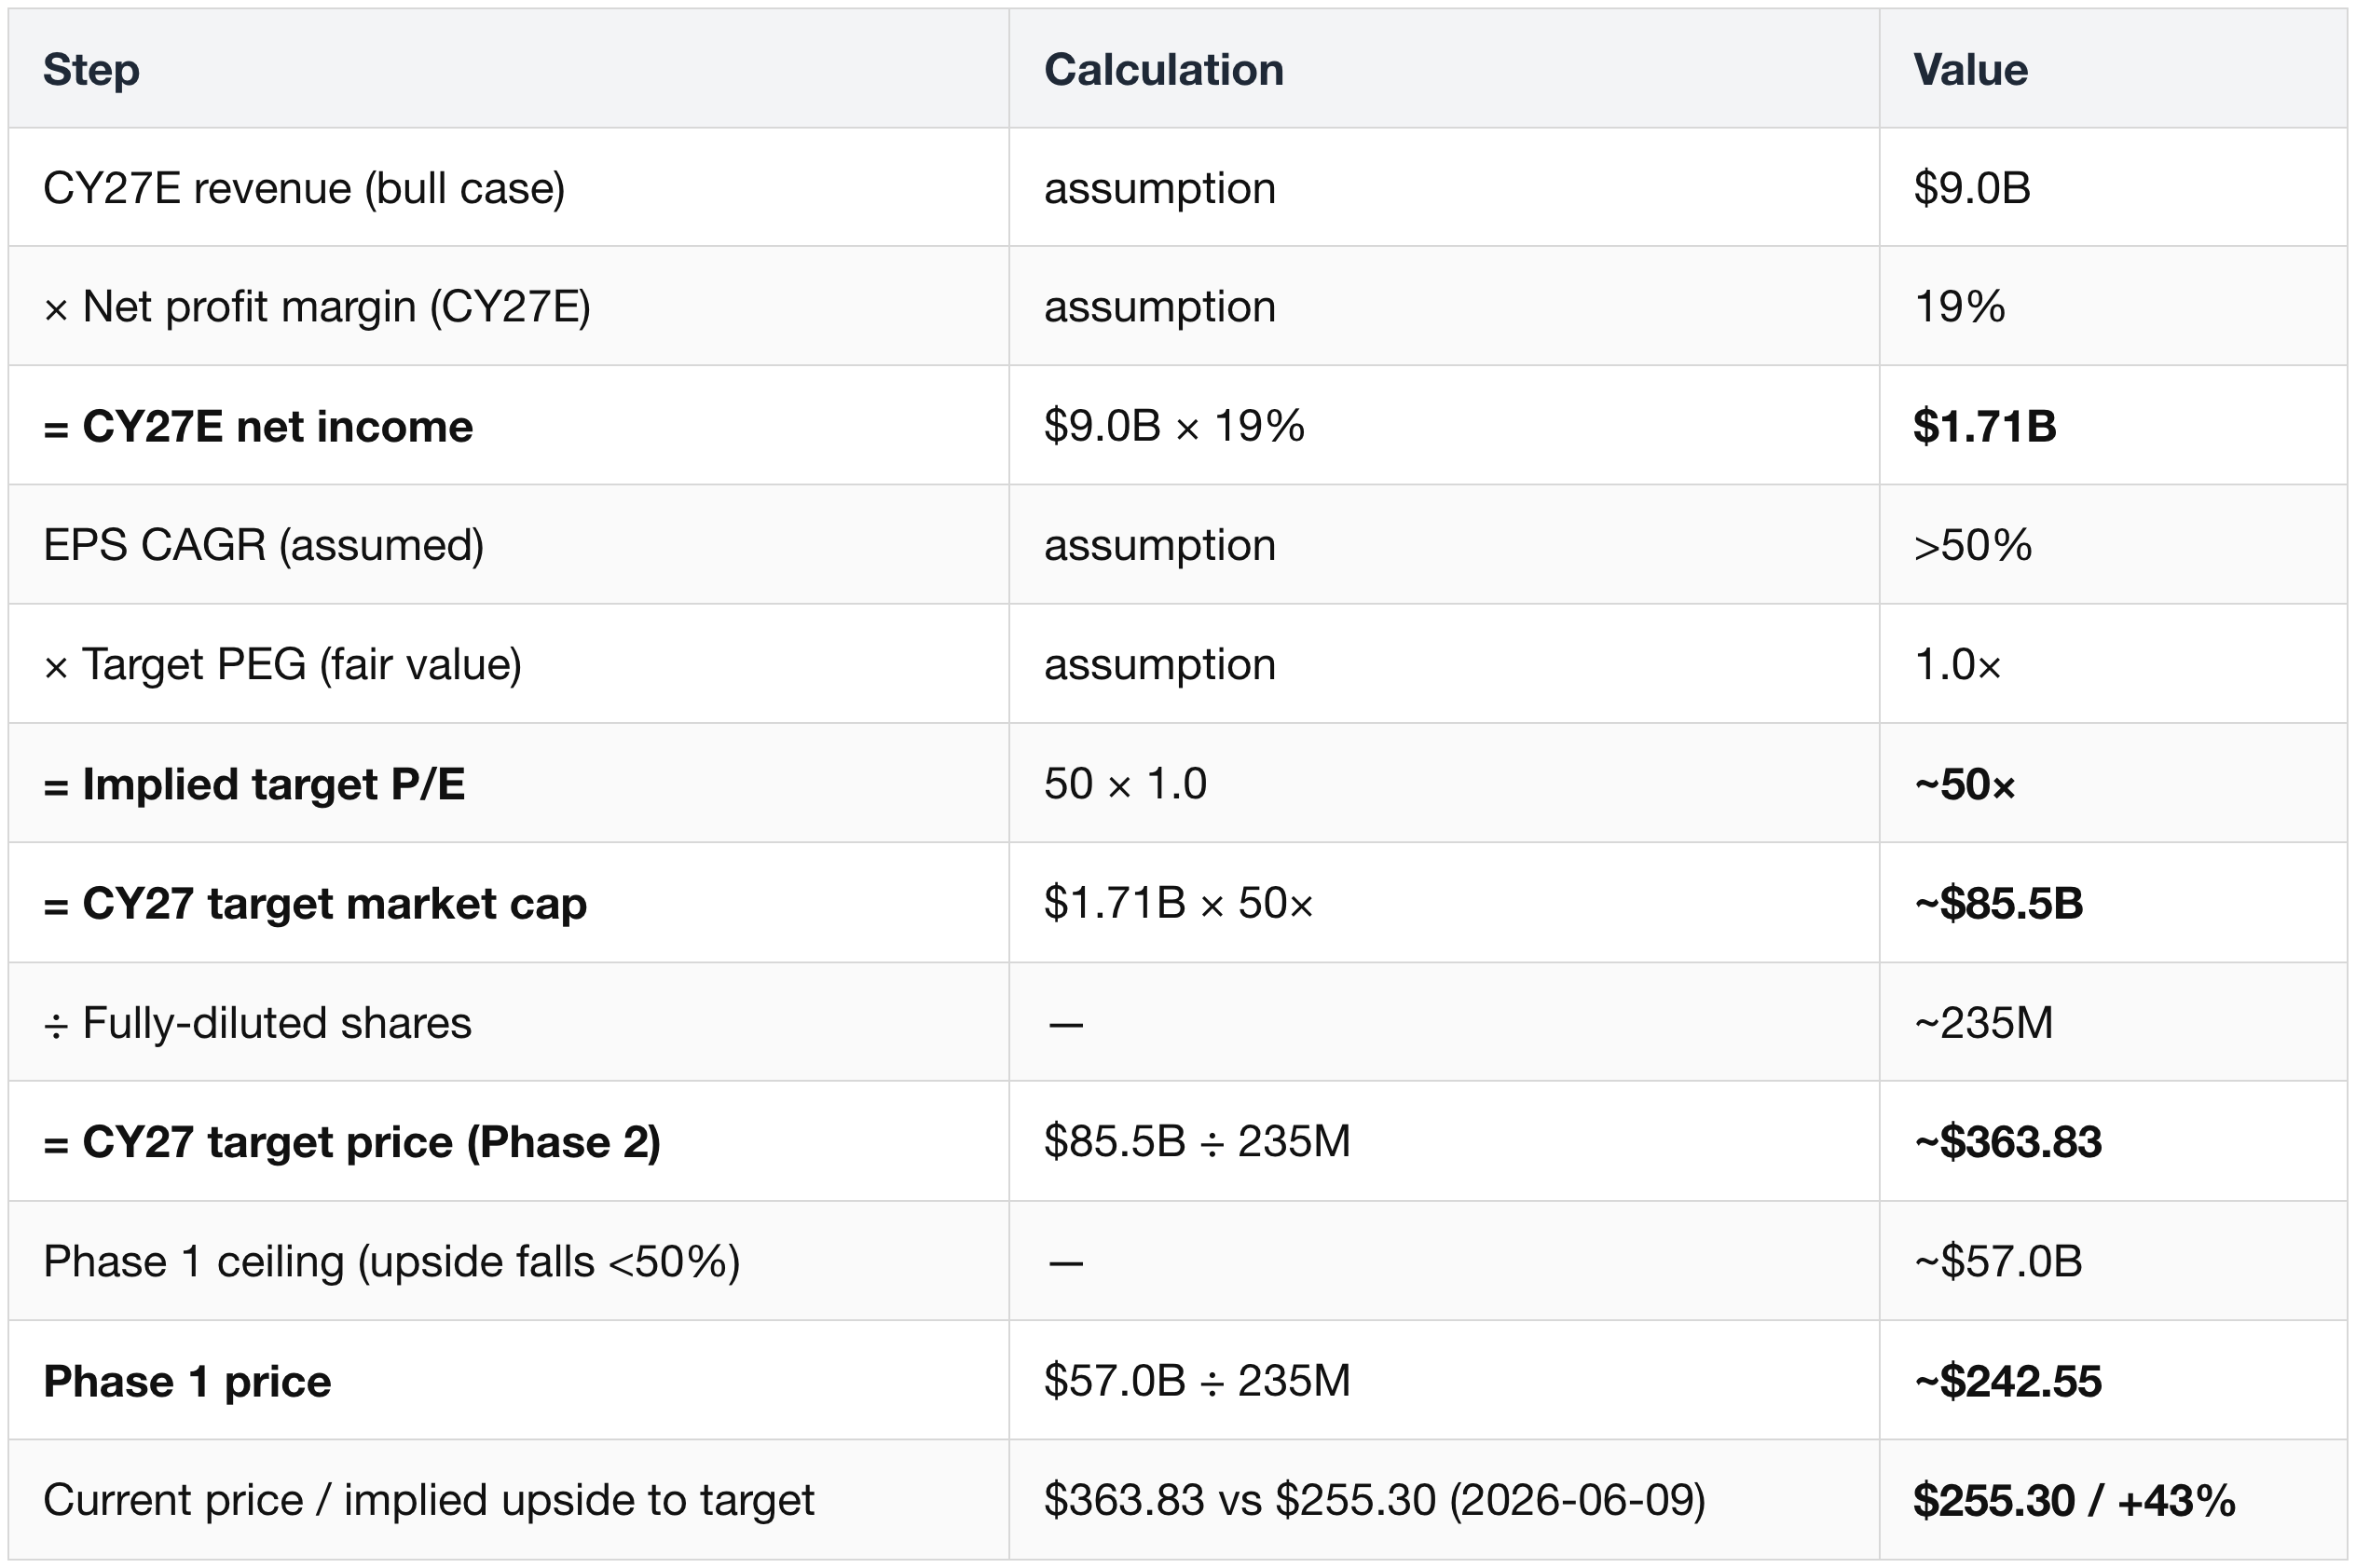
Two-phase rally framework:
- Phase 1 — P/E multiple expansion. A momentum rally with no PEG constraint, running until upside compresses below ~50% — at roughly a $57B market cap (~$242.55/share).
- Phase 2 — PEG re-rating. Past ~$57B, the "cheap relative to growth" narrative carries the stock toward the $85.5B / $363.83 CY27 target.
At ~$255.30 today, the stock is already past the Phase-1 $242.55 marker and into the Phase-2 zone; the $363.83 CY27 target is ~+43% from here. The entire chain hinges on the $9B CY27 revenue and 19% NPM landing — both well above current Street consensus, so this is the bull case, not a base case.
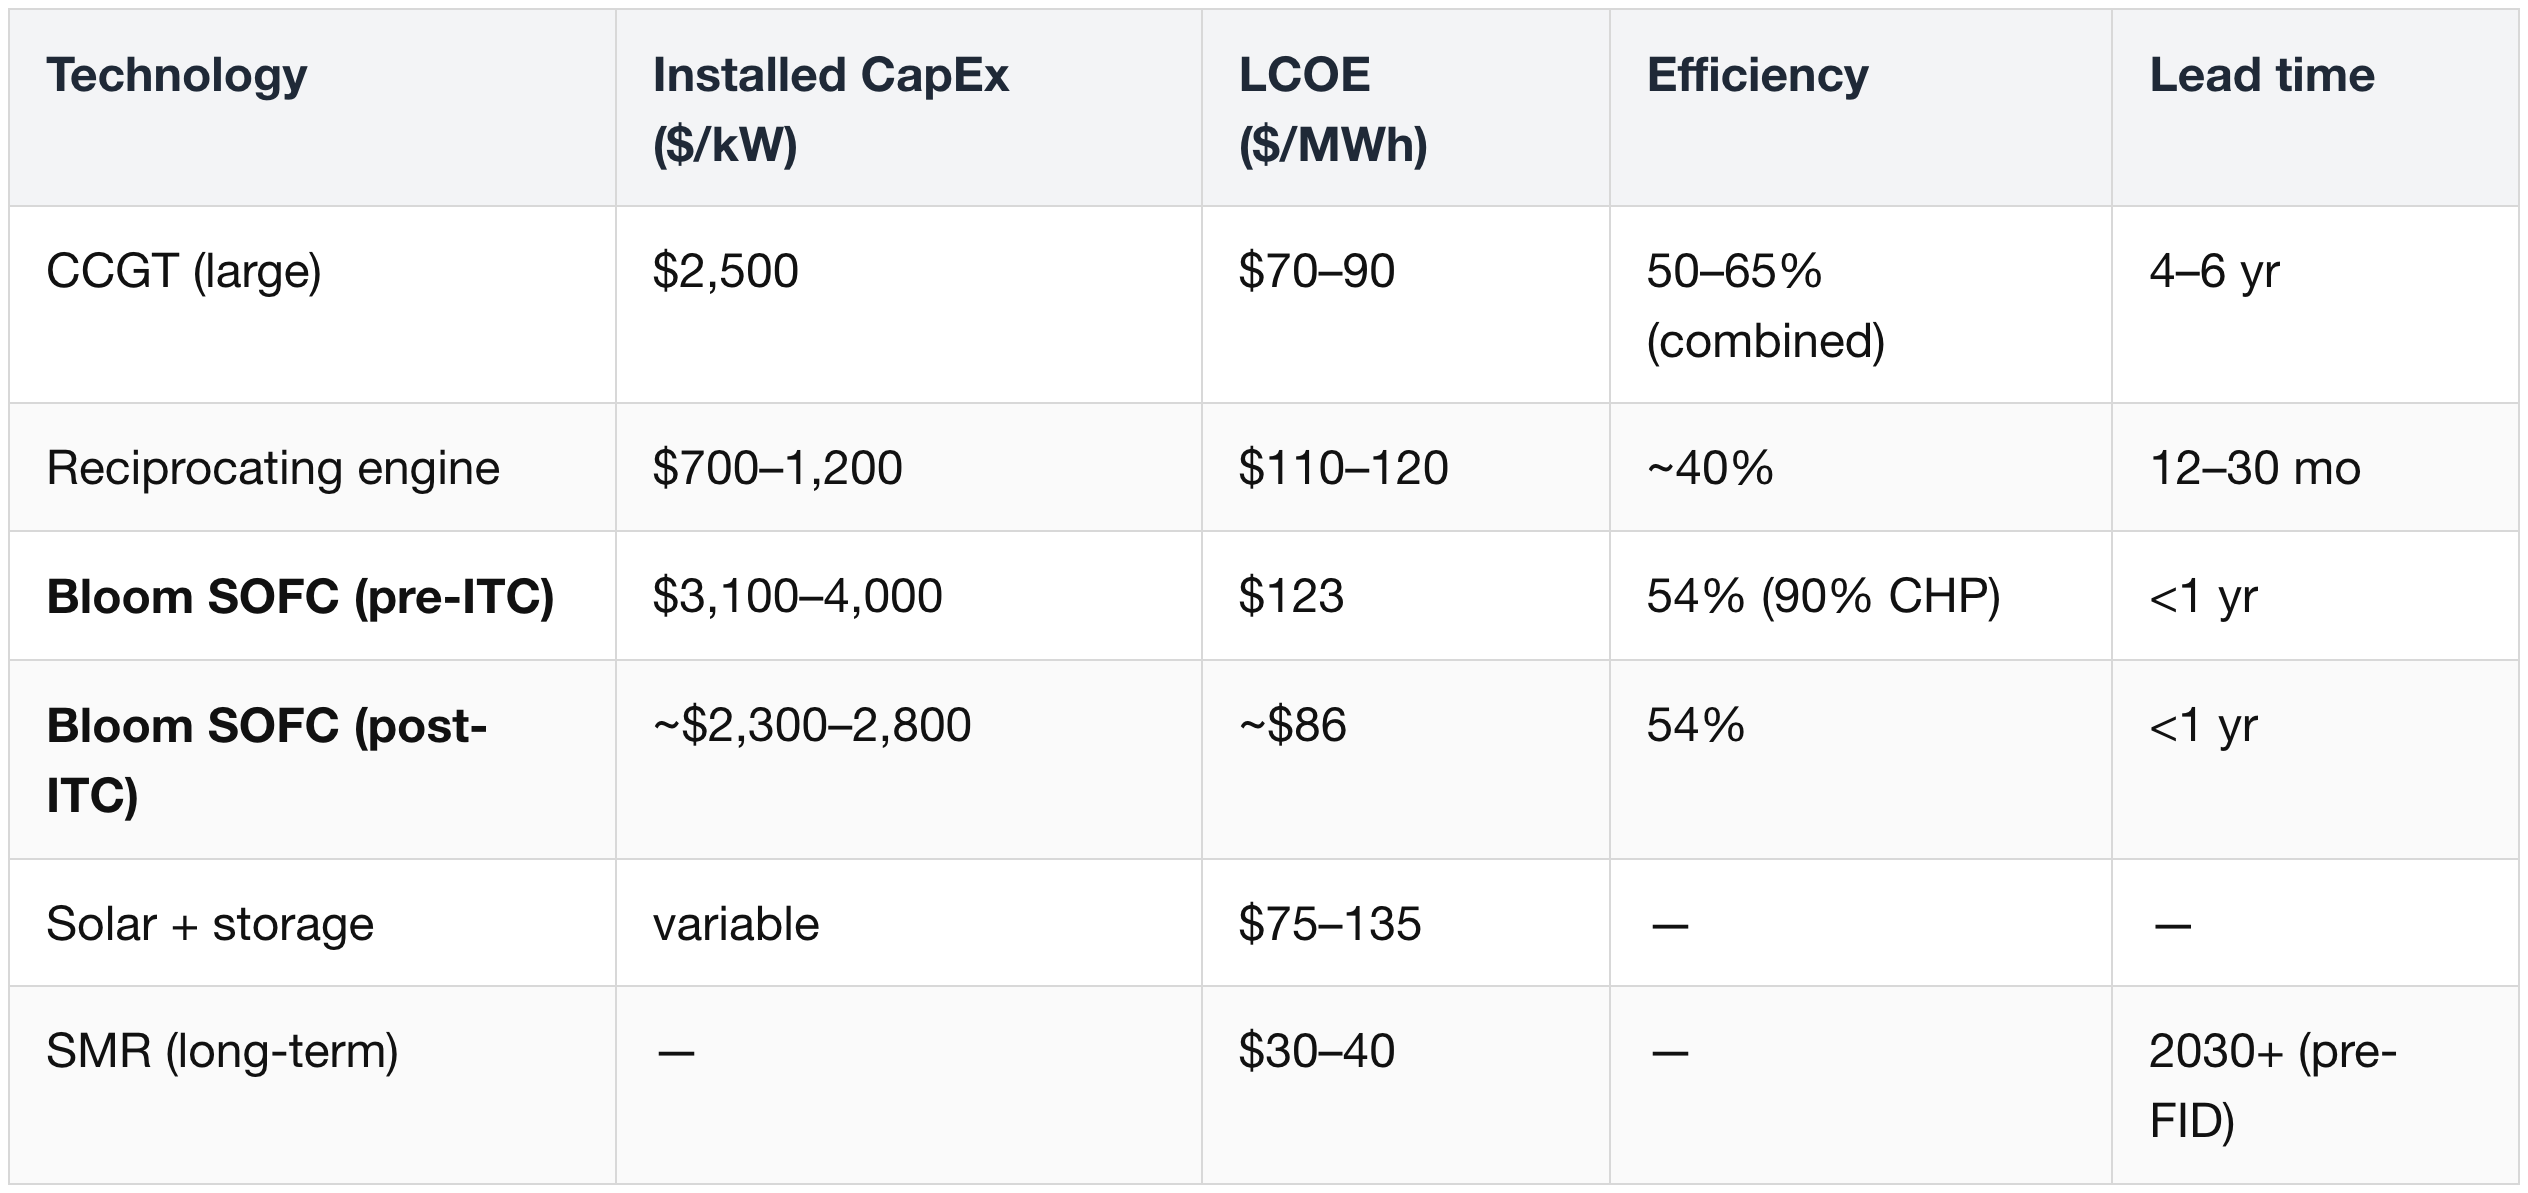
6.6 Unit economics — the LCOE picture
ITC = Investment Tax Credit
Bloom's cost-down roadmap:
- Average selling price $3,373 (2024) → $3,268 (2026E) → $3,085 (2027E);
- installed system cost $2,108 → $2,070 → $1,912.
- For hyperscalers, power infrastructure is only 2–4% of total project CapEx, so a 40–50% LCOE premium to turbines is dwarfed by the cost of delay.
Where SOFC sits on the LCOE curve — and why "cheap renewables" is misleading. Two numbers get quoted for Bloom's cost; they answer different questions, and the cleanest way to tell them apart is who owns the hardware:
- Buy the electricity from Bloom → ≈ $99/MWh.
- Under a 5-year PPA (9.9¢/kWh), Bloom — or a financier like Brookfield — owns, fuels, and maintains the Energy Server and sells you the power, with no capex or O&M on your side.
- It's a price, set to undercut the ~$130/MWh (13¢/kWh) US commercial grid average (helped by the ITC and cheap gas) — which is why the pitch lands.
- Own and run the system yourself → ≈ $120–130/MWh.
- Buy the Energy Server outright and the all-in levelized cost — capex + fuel + O&M + stack replacements + cost of capital over the 10–20-year life — lands here.
- It's a cost, computed on the same basis used for turbines and reactors, so SOFC sits above gas CCGT (~$90–105) but below a 2035 SMR (~$145–165).
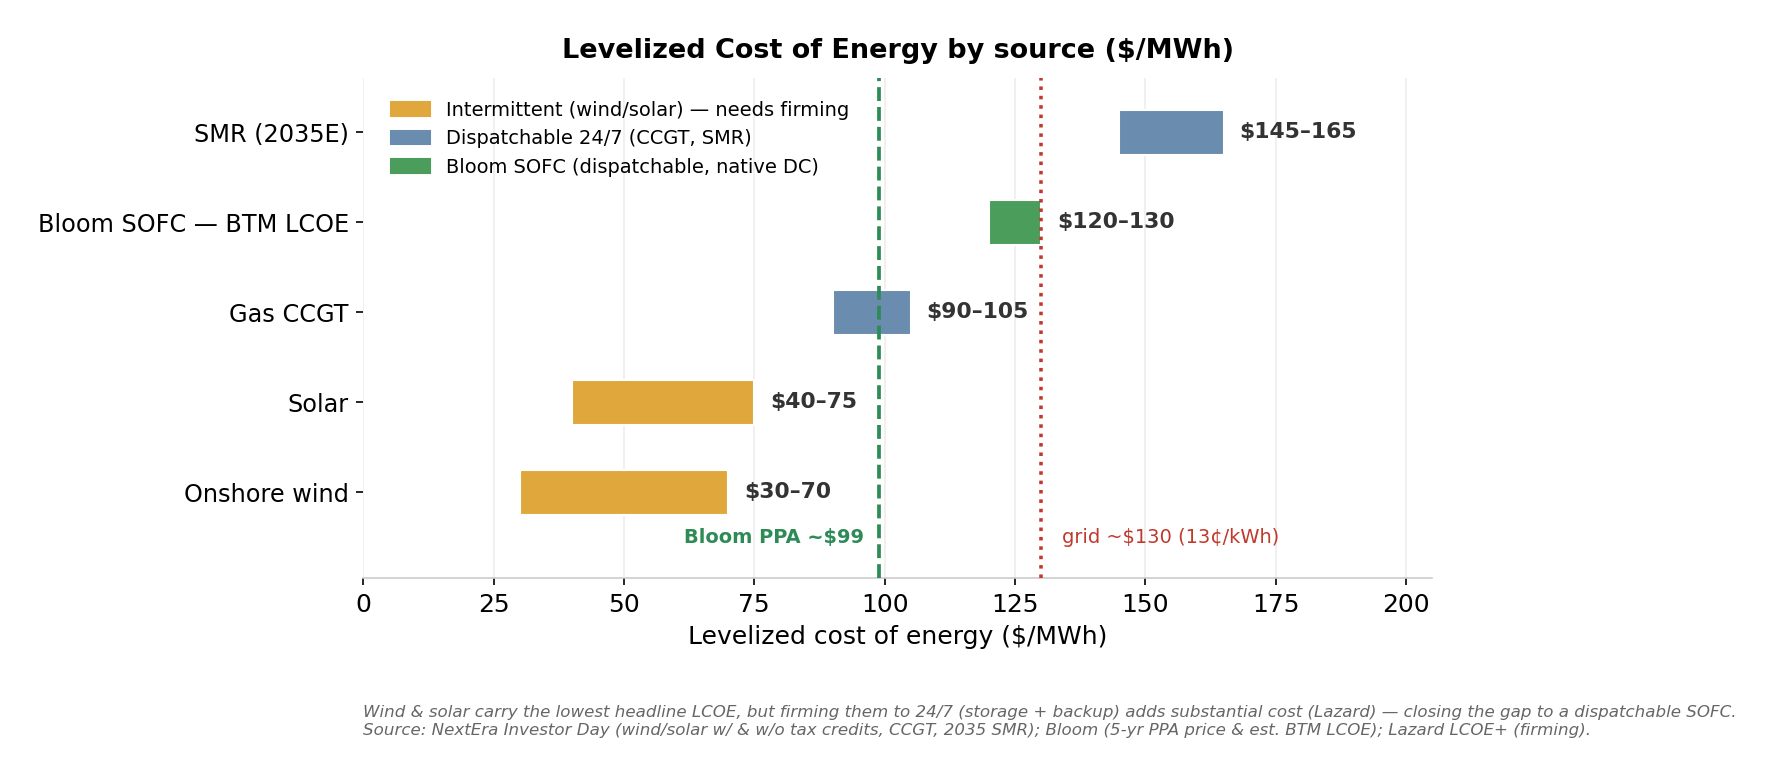
- The chart's point: wind and solar show the lowest headline LCOE, but they only generate intermittently. Firming them to the 24/7 reliability a datacenter needs (storage + backup) adds a large cost.
- For a 99.999%-uptime AI campus, the firmed comparison is the honest one.
- So both figures are right — they're a price vs a cost (think a car's lease payment vs its all-in cost-per-mile to own).
- Use the $99 price to compare Bloom against your grid bill;
- use the $120–130 LCOE to rank Bloom against other generation you'd own and run. (Quoting $99 against an SMR's $145–165 would be apples-to-oranges.)
7. The Forward Scorecard — Metrics & Narrative to Track
Leading indicators to validate (or falsify) the thesis through 2026–2027.
7.1 Demand / backlog quality
- Oracle optional 1.6 GW conversion — the single highest-leverage datapoint; conversion beyond the initial 1.2 GW validates Bloom's technology leadership.
- Non-Oracle backlog share staying >50%; new named hyperscaler/neocloud wins; GW contracted per quarter.
- Backlog growth — deceleration to <20% YoY would signal demand saturation.
- Annual new-order run-rate — 2025 booked ~$5B of new product orders (5× CY24); the tell for CY26 is whether that roughly doubles (→ ~$16B backlog). Bloom discloses orders only in Q4.
- New named projects — Hedgehog and Yellowbox (filed Jan–Feb 2026) are the next backlog adds to watch; they sit outside the current $6B.
7.2 Execution / operations
- Deployment cadence — implied 500–750 MW/quarter run-rate (2–3 GW/yr); revenue is now gated by customer greenfield construction, not Bloom's manufacturing. Watch installed MW vs. promised.
- Time-to-power proof points — repeat sub-90-day (sub-55-day) installs at scale.
- Capacity utilization vs the 5 GW annual ceiling; <50% would signal a demand shortfall.
- Capacity build-out — CY26 CapEx of $150–200M to take Fremont from ~1 GW to 3 GW (qualifiable to 5 GW); track product shipments ramping 0.5 → 1.2 → 2.7 GW.
7.3 Margins / financial quality
- GAAP net income turning durably positive (not just non-GAAP) — watch the interest/warrant bridge.
- Service gross margin trajectory (1% → 13% → 20%+) — the annuity engine.
- Product gross margin holding ~34%+ while scaling — sub-30% would flag pricing pressure or input inflation.
- Net margin trajectory — from ~8.7% (Q4 '25, ex one-time charge) toward the ~19% CY27 assumption, as Fremont utilization rises off ~50%.
7.4 Structural / architecture
- % of new orders specifying native 800 VDC vs legacy AC — the cleanest read on the architectural shift.
- Turbine-market tightness — if GE Vernova / Siemens / Mitsubishi add capacity or lead times shorten, the "search elsewhere" tailwind weakens.
- 800 VDC value-capture split — how much accrues to Bloom (generation) vs Vertiv / Eaton / Schneider (conversion).
- 800 VDC adoption curve — Bloom's developer survey puts ~60% adoption by 2028, and ranks SOFC the #1 on-site option (47%) ahead of reciprocating gas turbines (38%).
7.5 Risk / narrative-breakers — competition is the live one
SOFC and adjacent competition arriving in 2027–2029:
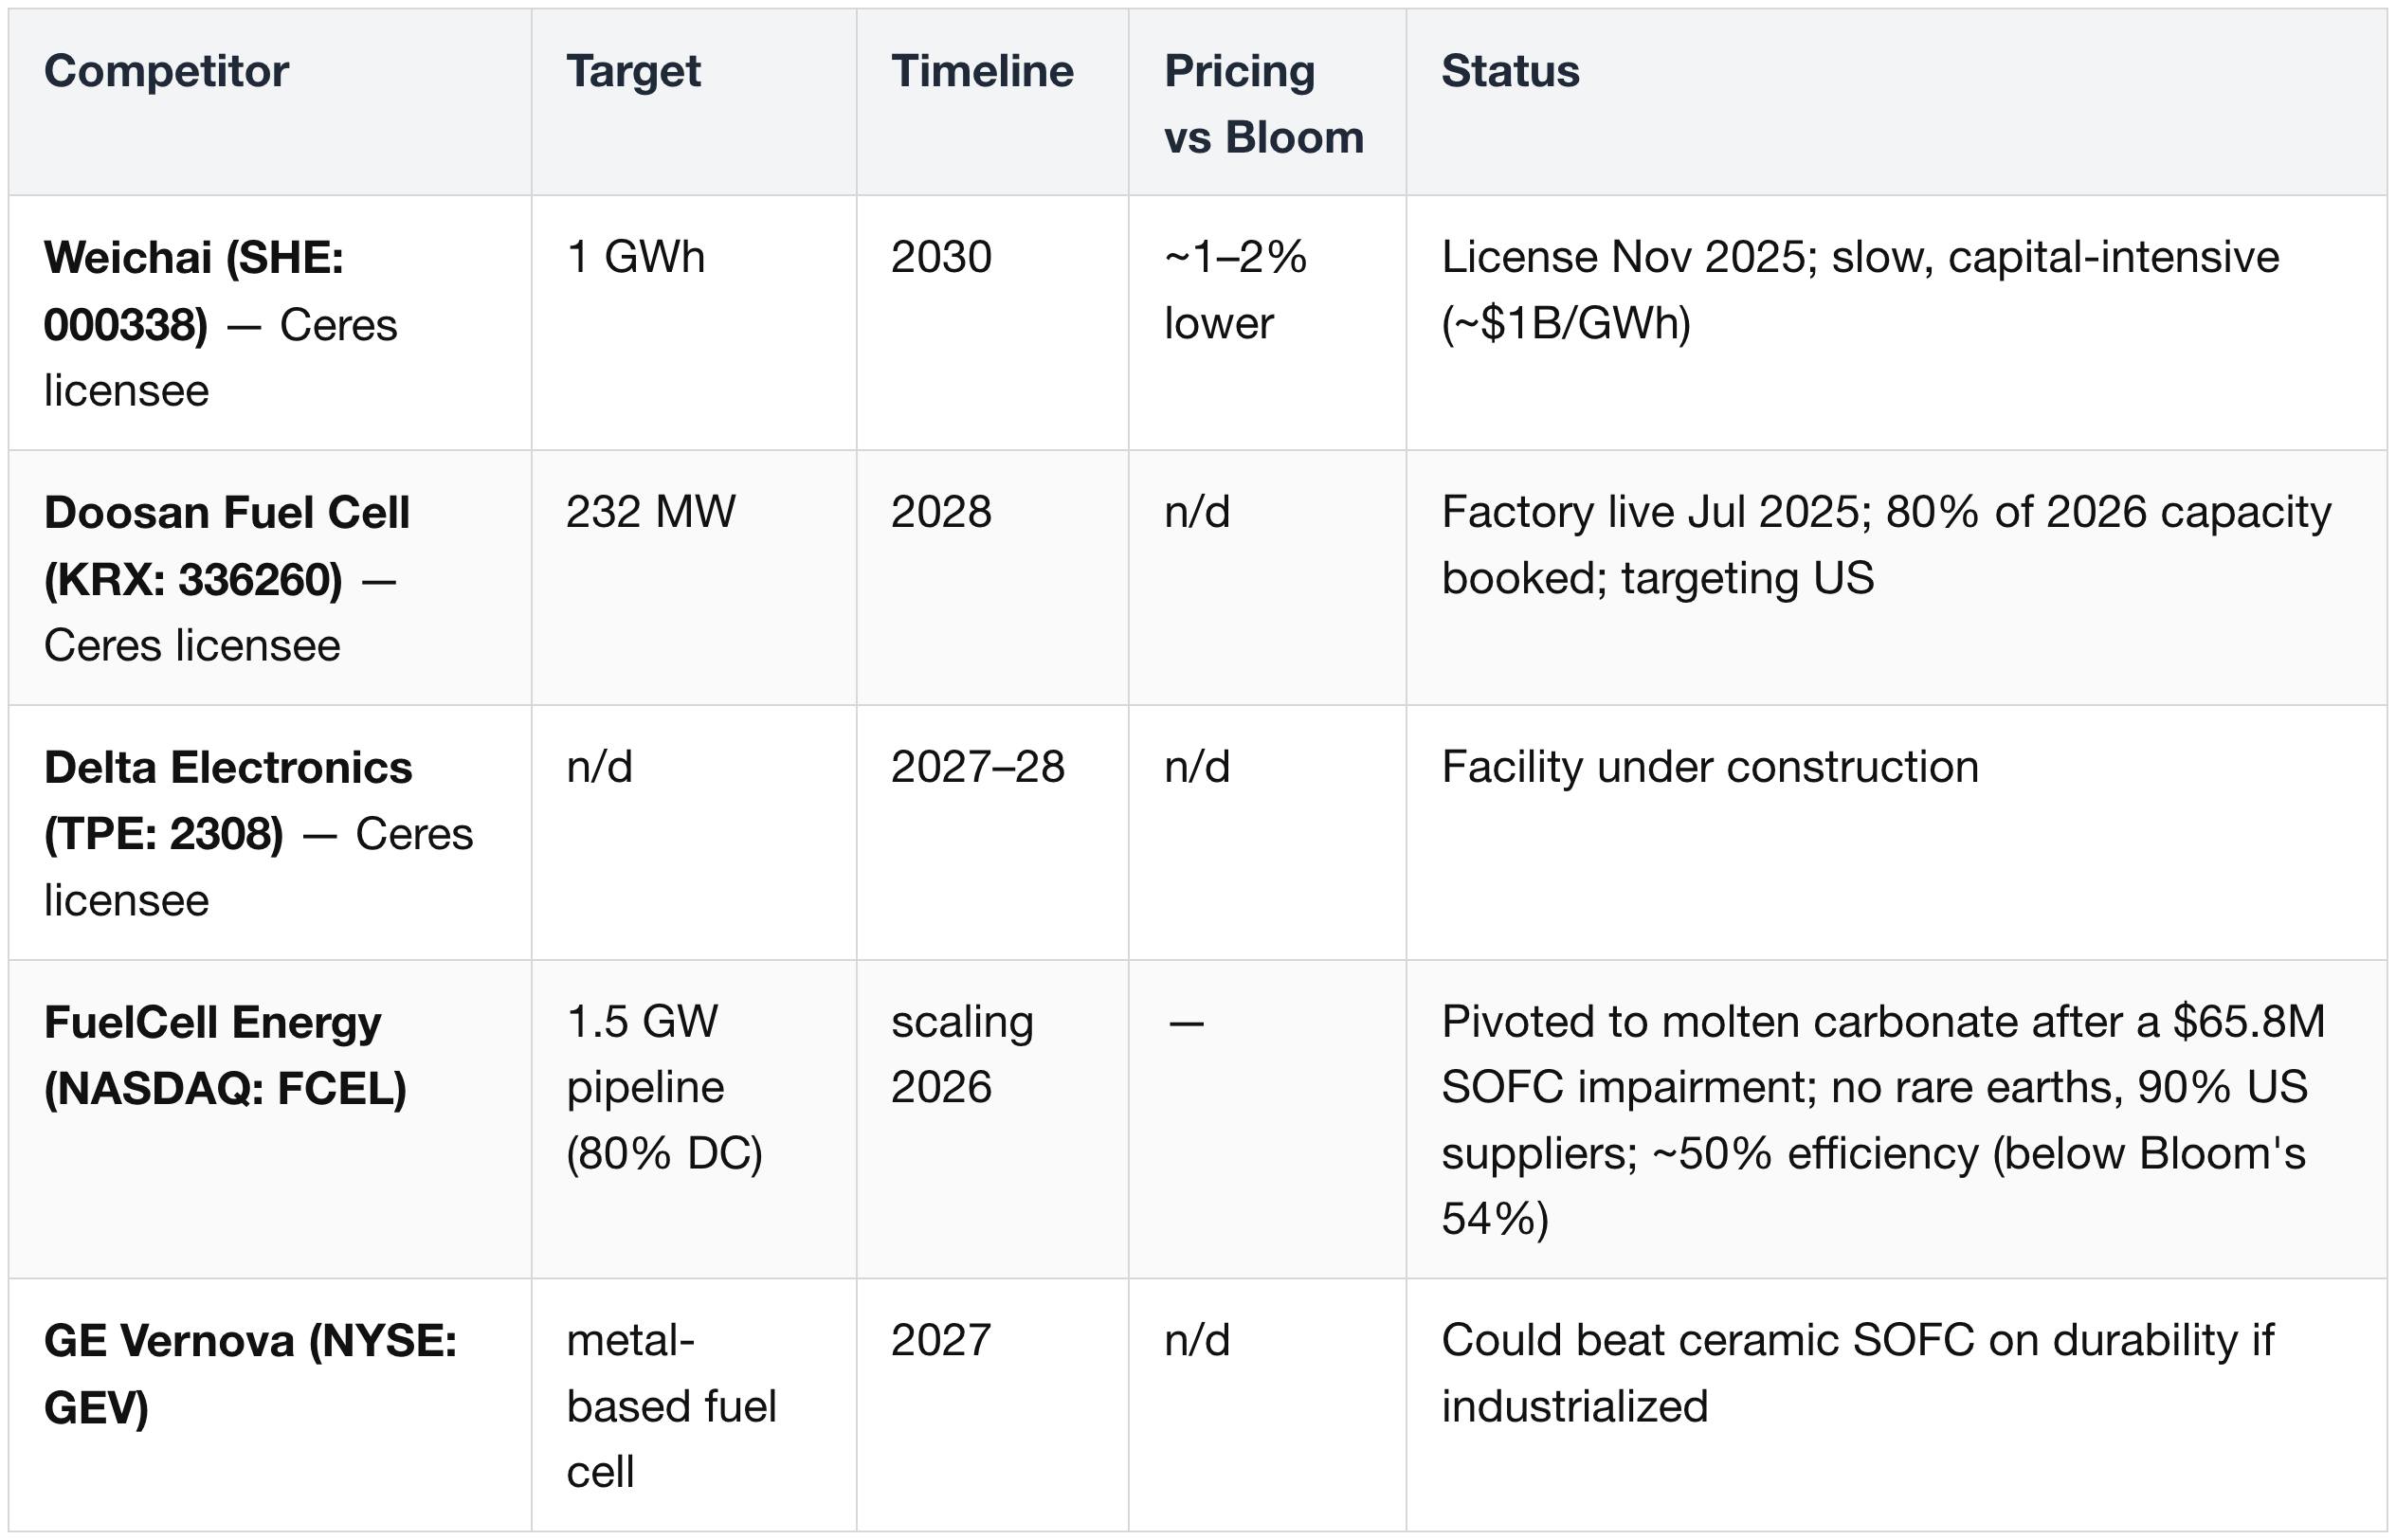
Other narrative-breakers:
- Market structure — the global SOFC market is forecast at 22 GW by 2030, with datacenters ~49% of it; watch for any company's (Ceres licensees such as Doosan Fuel Cell & Delta Electronics (though, currently Ceres Power does not possess any competitiveness) / GE Vernova) multi-GW hyperscaler win at materially lower pricing, or Bloom share slipping below 20%. (On why GE Vernova's SOFC is more likely a 2030s SOEC/SMR play than a near-term BTM threat, see §5.4.)
- Supply chain — (1) Scandium / rare-earth dependence (China tier-2/3 suppliers; Terrafame studying Finnish scandium) plus (2) 50% US tariffs on steel/aluminum/copper.
- Technology — the unproven 2-year stack-life extension; failure compresses margins and LCOE.
- Policy — fuel-cell economics lean on the ≥30% ITC; a rollback / reduction could hit the model.
- Execution — project delays pushing revenue to 2028+; state-level datacenter opposition (e.g., Ohio).
Narrative health check:
- On track if:
- (1) Oracle's optional GW converts;
- (2) Deployment cadence and GAAP profitability hold;
- (3) 800 VDC sites pick Bloom for generation;
- (4) SOFC rivals stay capacity-constrained / loses competitiveness for any reason
- Breaks if:
- (1) Backlog slips to 2028+;
- (2) Margins give way to growth;
- (3) Weichai / Doosan / GE Vernova win multi-GW hyperscaler orders at materially lower pricing (a near-impossible scenario).
Risks & Counter-Thesis (consolidated)
- Valuation depends on flawless execution — ~134× FY '26E P/E, compressing to ~58× FY '27E only if a >600% / +134% two-year EPS ramp lands; PEG ~1.0 is reasonable conditional on delivery.
- Value capture may accrue to facility-edge conversion vendors regardless of generation source; fuel cells remain <5% of datacenter power after 10+ years.
- "Voltage match" is partly marketing — the durable edge is bring-your-own-power speed + grid independence.
- GAAP profitability is new and thin; the debt/warrant bridge still matters.
- Competition + Scandium + tariffs + stack-life are concrete, and the moat might get narrower after 2027.