Q1 2025 Settlement

1. Net Trade P/L
The Q1 Net Trade P/L accounting first.
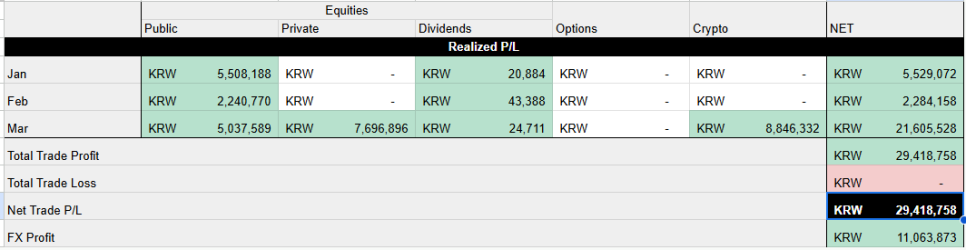
Total realized P&L KRW 29,418,758.
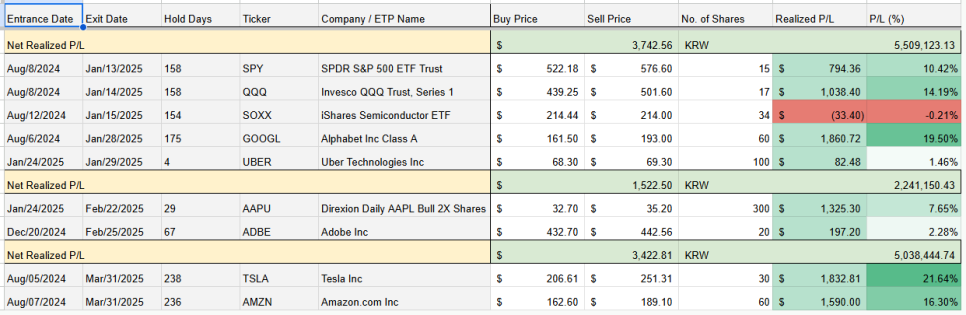
Public Equities trade record

Crypto trade record
- January: cashed out some holdings against potential volatility.
- February: entered some positions post-DeepSeek and ran short-term volatility trades.
- March: raised cash on fears of maximized volatility from stagflation noise (sells: $TSLA, $AMZN, BTC).
- $TSLA: 2/3 of the weight already taken last December; the remaining 1/3, left "to see how far it goes," was cleared.
- $AMZN: the second-easiest candidate after $TSLA for short-term cash.
- BTC: the long-run positive view stands, but with most watched names near undervalued levels in this correction, the answer to "which is more attractive short-to-medium term" was not Bitcoin — a short-horizon temporary cash-out.
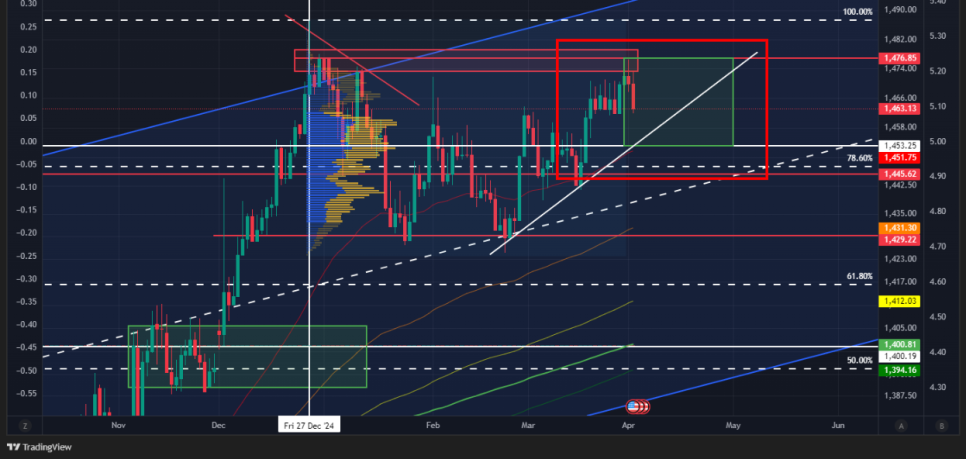
USDKRW
The Bitcoin cash-out was in KRW; I'll convert to USD gradually. In '25, the Bank of Korea's intervention near ₩1,475/$ is all too visible, so I'll likely take a split-conversion approach in the upper-right green box zone after a short-term USDKRW decline.
2. Market Retrospective
The list of potential macro-uncertainty risks I analyzed early this year (see the 2025 macro-uncertainty decomposition note):
- Unavoidable long-end supply increase from '25 US government financing.
- A dealer-capacity-shortage event from the bond-vigilante phenomenon + potential bond oversupply.
- Falling system liquidity in H1 '25 (a risk only within the equity scope given the flat RDE).
- Possible recovery delay from rising interest cost for infrastructure / manufacturing firms in '25.
One thing I grew complacent about: if it is an insight I can derive, the Trump administration and the Fed — the economy's pillars — surely know it too. So rather than stopping at deriving potential risks, I should have gone a step further and designed a probabilistic scenario of what the other side would choose to shrink that risk, reflecting it in trade decisions.
(1) (1)·(2) Long-end supply increase & dealer-capacity shortage
The essential risk reduces to (a) concern led by an expanding coupon share of issuance and (b) weakened market long-bond demand. The Trump administration would have been aware too. At end-'24 the US economy showed Sticky-Inflation signs; '25's fiscal-deficit-expansion potential + the coupon-share-expansion signal cut long-bond demand, producing a bond-vigilante phenomenon despite the Fed's repeated cuts. The Treasury cannot do net issuance (debt-issuance limit exceeded) and the TGA is draining.
Per the US Q2 liquidity-outlook note: after the 2023 debt-ceiling deal, TGA funding had a substantial $2.25T RRP to cushion the system-liquidity-absorption shock; now RRP is at $399.17B — quite insufficient for the TGA funding amount.
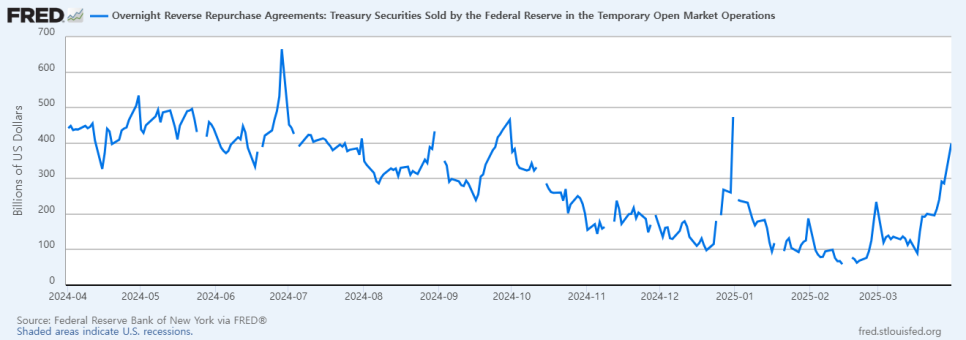
ONRRP balance
How to reach the TGA target of $850B after the debt-ceiling deal? The Fed and the Trump administration both recognize this and are arranging liquidity sources:
- The Fed hinted at a QT pause in the February FOMC minutes, and at the March FOMC announced cutting the monthly SOMA Treasury runoff from $25B to $5B (until the debt-ceiling issue is resolved).
- The Trump administration arranges a liquidity-supply mechanism by exempting Treasuries within the SLR (Supplementary Leverage Ratio) regulation, lowering banks' capital-maintenance ratio.
That is — where RRP MMF money had bought issuance, now the buyer is steered toward commercial banks. Securing a buyer alone is not enough; demand must follow.
3. Inference
This is likely the administration's strategy — expand long-bond demand. How? Via potential-stagflation fear.
- Post-Trump-win end-'24 through early Q1 '25 there was reciprocal/universal-tariff inflation concern,
- and as Musk's DOGE-led mass government-staff cuts began in earnest, consumption-slowdown concern showed in soft data (fortunately hard data still uncertain).
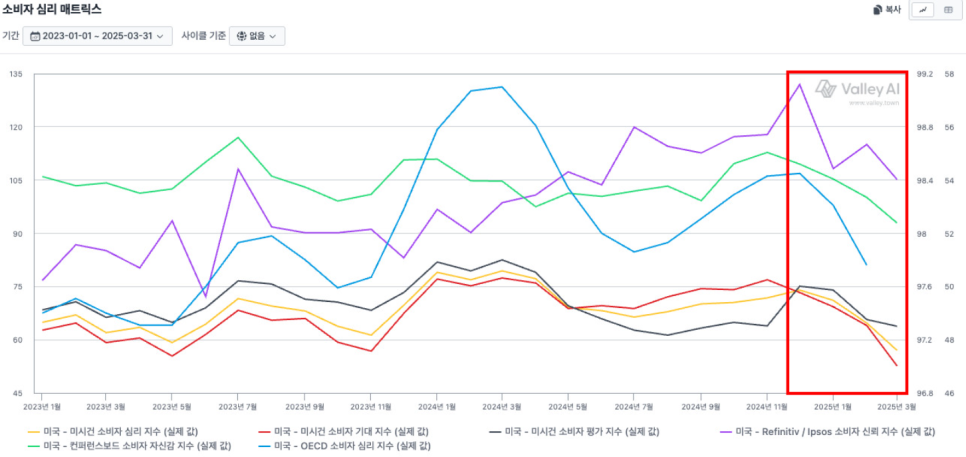
soft data — consumer-sentiment matrix trend
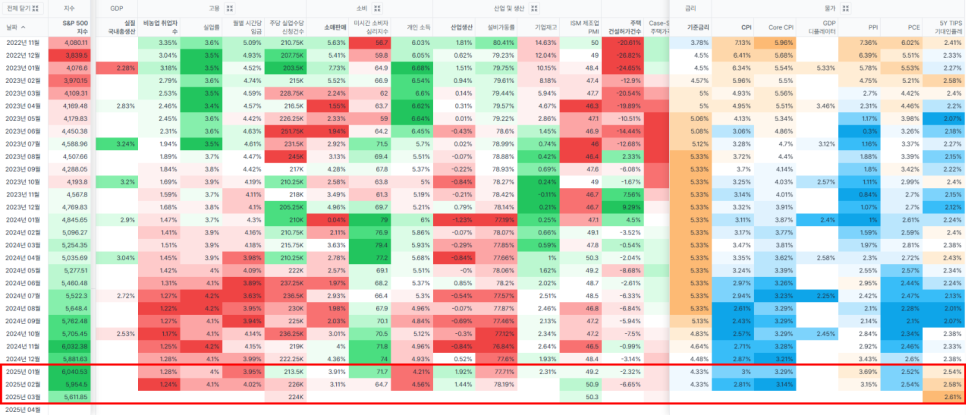
hard data — employment, consumption, industry & production, inflation, etc.
- Inflation + consumption slowdown → stagflation.
- Using potential stagflation risk as a pretext, equities take a correction,
- and in this anxiety, funds leaving the Treasury TGA and equities are rotating into RRP and long bonds.
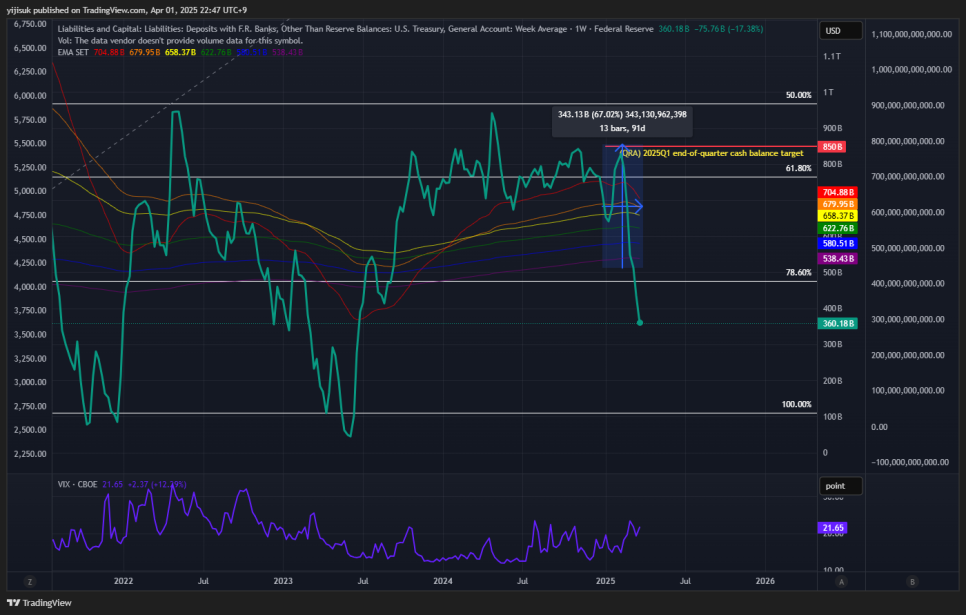
US Treasury TGA balance
- Conveniently, the April 2 reciprocal/universal tariffs, being early, will likely come out hard — with the potential to be used as a negotiating tool, fitting the administration's purpose.
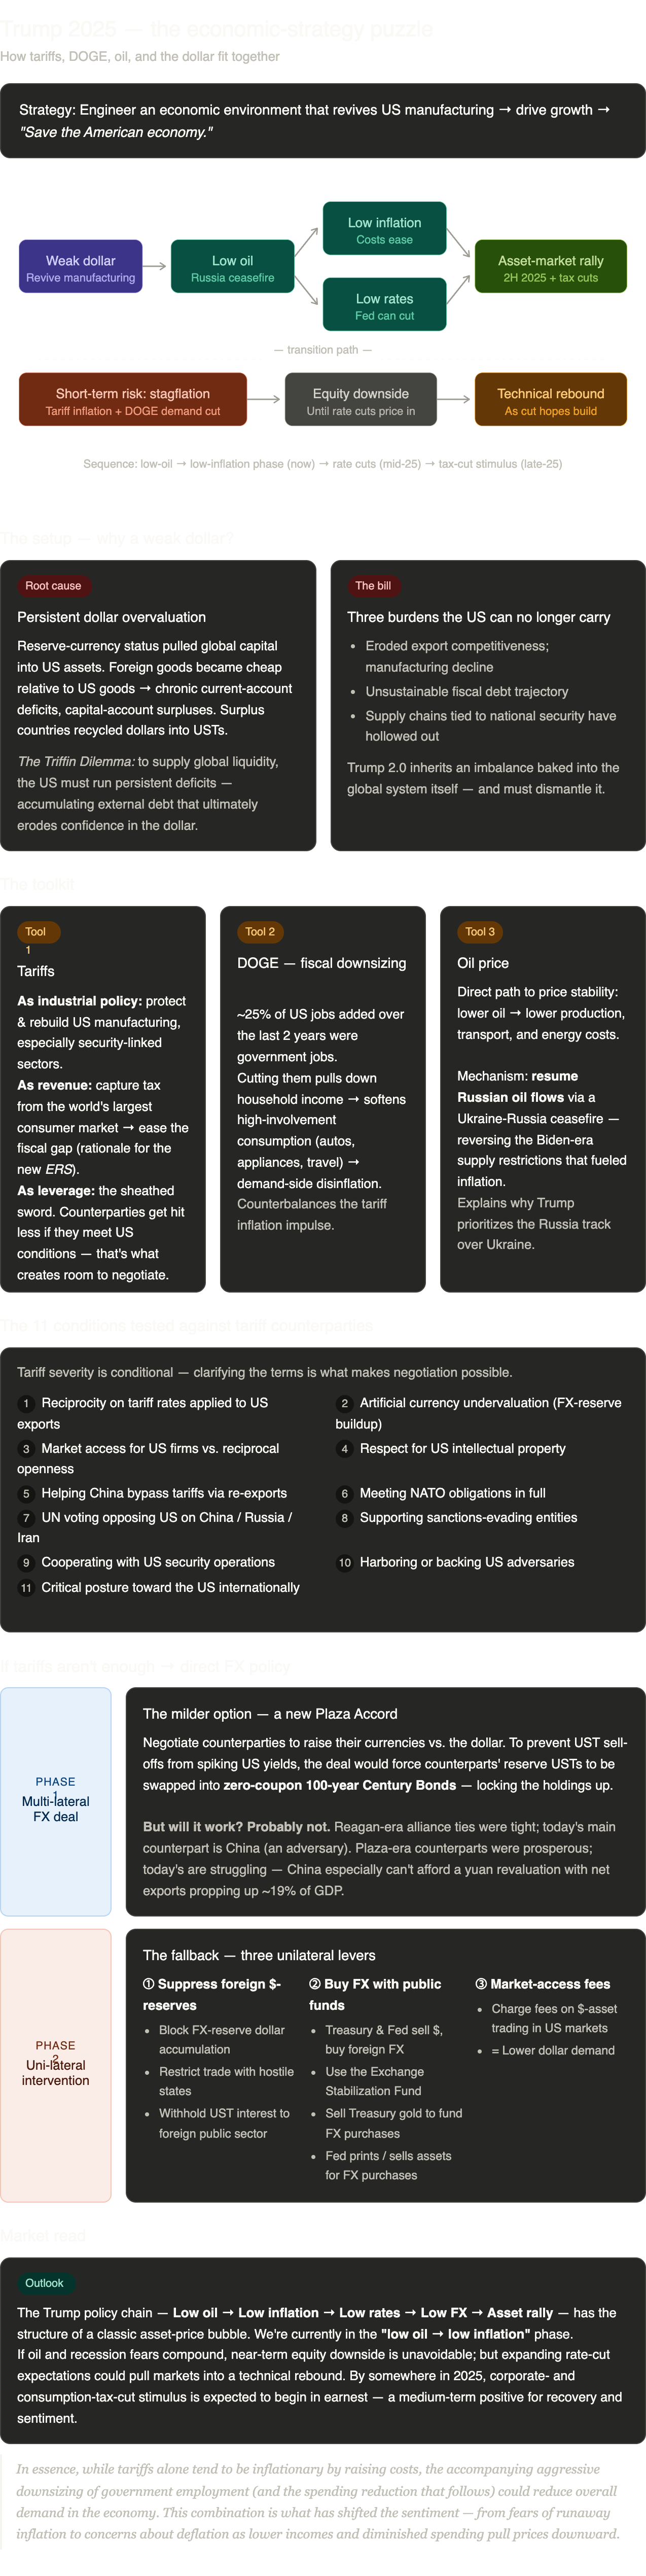
A User's Guide to Restructuring the Global Trading System — a Nov '24 paper by CEA Chair Stephen Miran. Significant given his Trump-administration economic-advisor positioning; one can infer the administration's big picture (rather extreme; a cleaned-up diagram version to follow).
- Catching the moment long-bond demand strengthens, drain the Treasury TGA and, after a debt-ceiling deal, issue new long bonds for a stable(?) refill of liquidity and government capital.
- This solves both the long-bond-demand problem and the Treasury-funding problem — the only one harmed is equities.
- But it is concerning that Trump still believes the equity trend can reverse at any time.
4. Market Dynamics — A Trading View
Reading the tape from a trading view: Funding Spread and cross-market liquidity flow.
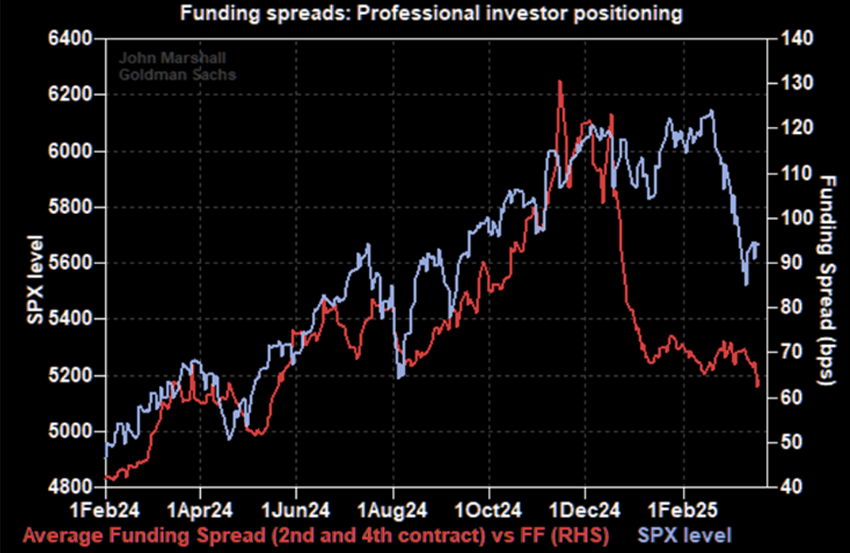
Institutions like hedge funds, rather than investing directly in an underlying like the S&P 500, often build "a payoff similar to holding the asset" via options / futures / swaps to raise leverage; the cost of that is measured by the funding spread. A rising funding spread means institutions are expanding (mostly long) positions; falling means trimming.
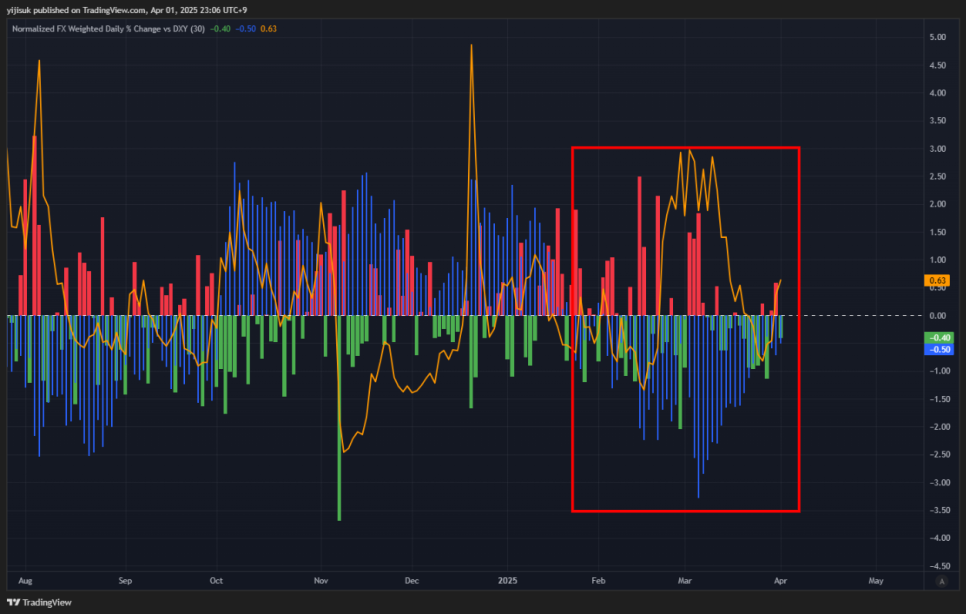
From early '25, dollar outflow strengthened vs inflow, driving the DXY's bearish turn
From early January '25 the funding spread plunged. But record-strong retail buying was supporting the large declines.
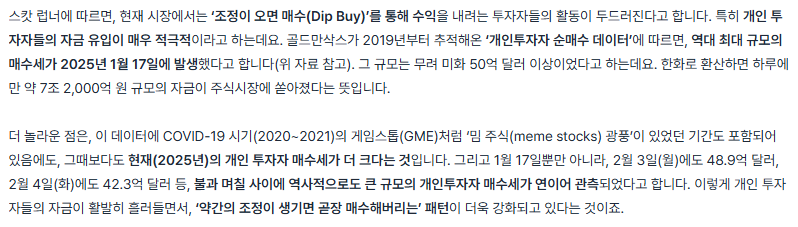
From the start of '25, retail buying was record-strong
- From another angle, institutions were offloading all the inventory onto retail.
- Retail buying has limits, and after it stopped, a retail-only selling tape widened the Bid-Ask Spread and exaggerated the drawdown.
Why did institutions start clearing US inventory from early '25? The main cause seems to be China's and Europe's pre-emptive responses to future Trump-administration tariffs. If the US applies an x% tariff on imports, an exporter can offset the effect by devaluing its currency x% (more money supply → lower value).
- China: a liquidity-release signal for tariff response, ostensibly economic stimulus (tech momentum especially strong on the DeepSeek episode).
- Europe: facing a US-troop-withdrawal crisis, raising defense spending — i.e. a liquidity-release signal.
On liquidity-release expectations, funds temporarily crowded into China / Europe and the market began doubting US exceptionalism.
China/Europe liquidity-release signals → lower US relative attractiveness
→ US → overseas capital outflow → US-market liquidity shortage
→ plus US stagflation noise
→ institutions already offloaded to retail (funding spread plunged), only retail left in the selling tape
→ a fairly severe volatility tape
5. Conclusion
Lessons from the Q1 retrospective:
- Don't stop at deriving potential risks — go a step further and design a probabilistic scenario of the other side's choices to shrink that risk, reflecting it in trade decisions.
- The market has, broadly, two players — institutions and retail. Who leads the flow? The moment it passes from institutions to retail, beware volatility.
- Also watch: macro liquidity metrics and soft & hard data, the international liquidity flow inferred from FX rates, institutional funding spreads.