Taking the Liquidity Temperature Pt. 1 | Fundamentals

— "Earnings don't move the overall market; it's the Federal Reserve Board… focus on the central banks and focus on the movement of liquidity… most people in the market are looking for earnings and conventional measures. It's liquidity that moves markets." (Stanley Druckenmiller)
As the drawdowns in the S&P 500 and Nasdaq 100 deepen, it becomes clear again that the primary variable moving markets is system liquidity. Macro headlines and earnings are second-order variables layered on top of it.
Liquidity is the core. So how do you measure system liquidity? This piece covers the fundamentals of that measurement.
1. The Five Determinants of Market Liquidity
"System liquidity" is read through the balance sheet of the Federal Reserve, the institution that runs monetary policy. A balance sheet has three components — assets, liabilities, and owner's equity.
Assets = Liabilities + Owner's Equity
(1) The asset side
1) Securities Held Outright
The Fed's SOMA (System Open Market Account) — the account that holds the securities the Fed owns. It moves mainly with quantitative easing (QE) and tightening (QT).
- QE buys Treasuries, raising the SOMA balance.
- QT shrinks holdings, lowering the SOMA balance.
2) Liquidity and Credit Facilities
The Fed's lending (liquidity) facilities — the channel for supplying liquidity to banks via loans during financial stress. The most recent instance: during the 2023 SVB / regional-bank run, lending against banks' Treasuries as collateral.
(2) The liabilities + equity side
1) Reserve Balances with Federal Reserve Banks
Bank reserves.
- Cash banks hold at the Fed, at a set ratio, against customer (household / corporate / institutional) withdrawal demand.
- Rising reserves signal that banks are extending, or have room to extend, more credit. Since system liquidity is ultimately supplied through banks, this is the key gauge of the current liquidity level.
2) US Treasury General Account
The Treasury's TGA balance — a cash account the Treasury holds at the Fed, drawable at any time. It moves with fiscal deficits and fiscal outlays:
- Deficit (outlays 〉 receipts): the Treasury issues additional debt to fund spending. Issuance → market bids (liquidity pulled from banks) → bank reserves down → TGA balance up.
- Outlay: the TGA's liquidity is released to the market. TGA down → bank reserves back up.
3) Reverse Repurchase Agreements
The Fed's RRP balance — think of it as a savings account at the Fed. MMFs (money market funds), private funds, and dealers parking spare cash earn the RRP rate.
(3) Reducing it to an identity
The basic identity is Assets = Liabilities + Owner's Equity, but the Fed's equity is negligible, so Assets = Liabilities is a fair approximation. Substituting the components:
Securities Held Outright + Liquidity and Credit Facilities
  = Reserve Balances + US Treasury General Account + Reverse Repurchase Agreements
Simplified:
SOMA + Lending facilities = Reserves + Treasury TGA + RRP
Applying the change operator Δ to both sides and rearranging around reserves — the proxy for system liquidity:
ΔReserves = ΔSOMA + ΔLending facilities − ΔTreasury TGA − ΔRRP
- As the Fed's asset side (SOMA, lending facilities) rises, market liquidity expands; as it falls, liquidity is absorbed.
- As the Fed's liability side (Treasury TGA, RRP) falls, market liquidity expands; as it rises, liquidity is absorbed.
2. Defining the Rates
The market's preoccupation is where the Fed sets the policy rate. What is the policy rate?
Its precise name is the Federal Funds Rate — the rate on short-term (mostly overnight), unsecured interbank lending among US financial institutions. It is published as a range, not a single value, and the Fed steers that range through market mechanics via the IORB (Interest on Reserve Balances) and the RRP rate. As of this writing (Aug 5, 2024), the FFR is 5.25%–5.50%.
(1) IORB — the opportunity cost for banks
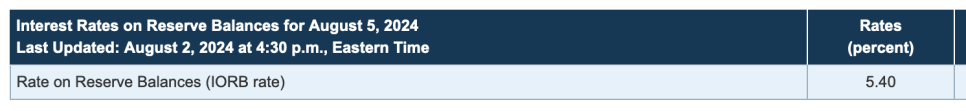
With spare cash, a bank has two income options: (i) park it at the Fed, or (ii) lend it short-term to another institution. Parking at the Fed earns the IORB rate, so if IORB is 5.4%, a bank has no incentive to lend to non-Fed counterparties below that. IORB is therefore the bank's opportunity cost.
(2) The RRP rate — the opportunity cost for non-banks
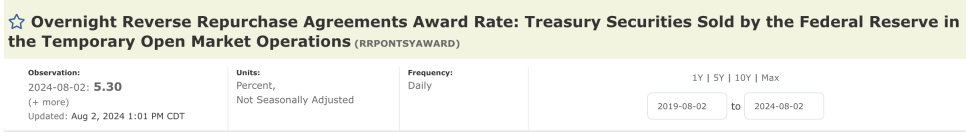
Non-bank institutions (MMFs, private funds, dealers) cannot earn IORB; instead they park cash in the Fed's RRP account and earn the RRP rate. So the 5.3% RRP rate is their opportunity cost.
IORB and the RRP rate induce institutions to "save" at the Fed and, through market mechanics, set a floor under market rates. Given these opportunity costs, market rates are designed to sit above IORB and the RRP rate.
(3) FFR — a market that lost its signal value
A closer look at the Federal Funds Rate, known as the policy rate. Banks were once the main participants; today it is a near-static market with almost no transactions.
- Post-GFC QE pushed reserves into the trillions, reducing the incentive to borrow unsecured.
- Basel III encouraged a reduction in unsecured short-term lending.
As a result the FFR lost its value as an indicator of short-term funding conditions; SOFR is now watched more closely.
(4) SOFR — the plumbing of the financial system
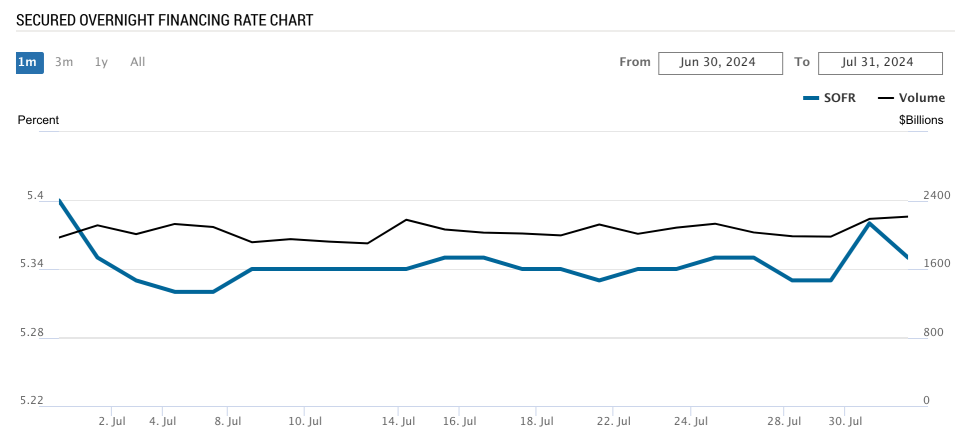
The rate at which banks raise overnight funding against Treasury collateral. Because Treasuries can be pledged for a loan at any time, SOFR confers very high liquidity on the Treasury market.
3. The Level of Rates, and the Exception
These rates move within a market-determined band. In descending order:
- IORB 〉 FFR — because non-banks cannot earn IORB.
- FFR 〉 SOFR — because secured lending carries less risk than unsecured.
So the ordering is IORB 〉 FFR 〉 SOFR 〉 RRP. In theory the RRP rate is the absolute floor — the Fed is risk-free.
But an exception arises. The RRP take is capped at $160B per counterparty per day. When system liquidity is so abundant that cash floods into RRP, the cash RRP cannot absorb temporarily migrates toward SOFR, and SOFR prints below the RRP rate.
Part 2 traces the flow of liquidity from March 2022 — when the Fed began hiking aggressively after the pandemic eased.