Taking the Liquidity Temperature Pt. 2 | The Shifts (2022-2024)
Carrying the identity built in Part 1 — ΔReserves = ΔSOMA + ΔLending facilities − ΔTreasury TGA − ΔRRP — this part traces where liquidity moved from March 2022, when the Fed began hiking, through 2024, across five regimes.
1. March–May 2022 (Equities → RRP)
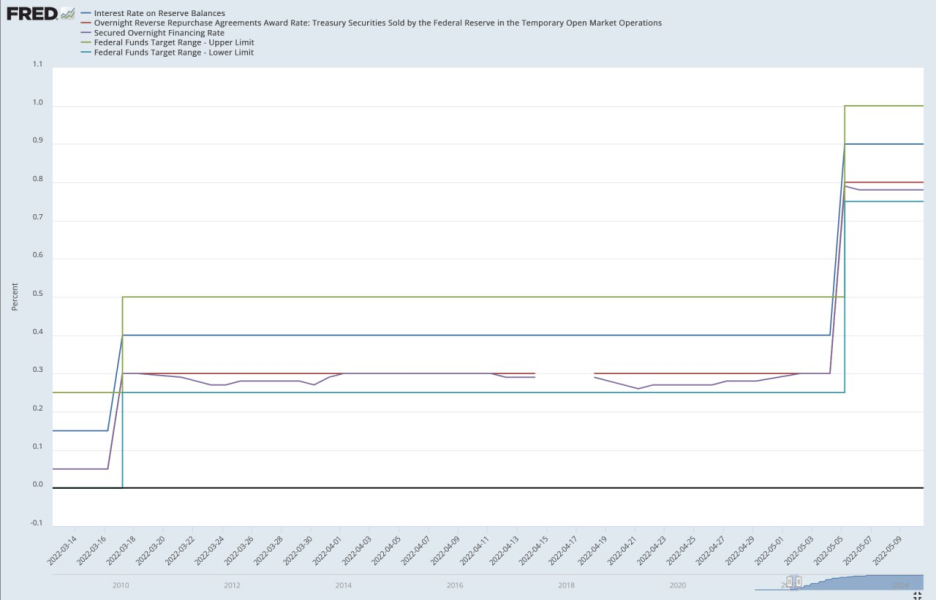
The Fed's 2022 hikes pushed liquidity out of equity and bond markets into the now-higher-yielding short-term funding markets. Cash overflowed even the RRP market, and SOFR briefly printed below the RRP rate. Cash crowded into RRP because:
- Rising real-economy uncertainty — a preference for the zero-credit-risk Fed RRP account.
- Post-pandemic, shrinking T-bill supply reduced alternative short-term destinations, favoring RRP.
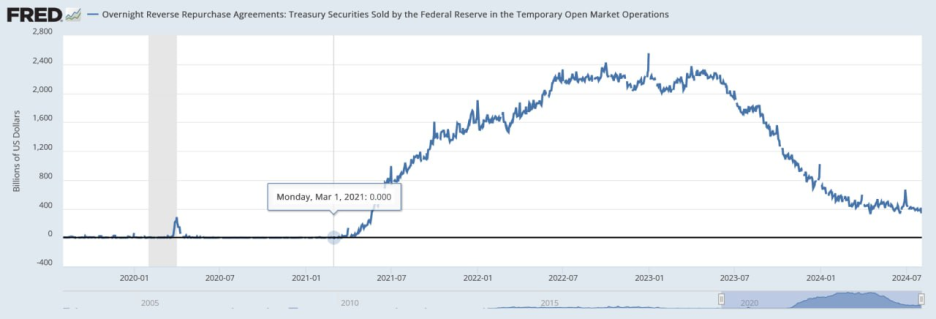
RRP balance since 2022
From March 2022 the RRP balance surged. Substituting into the identity:
ΔReserves ↓ = ΔSOMA + ΔLending facilities − ΔTreasury TGA − ΔRRP ↑
As RRP filled, reserves drained. The decline began in earnest in April 2022.
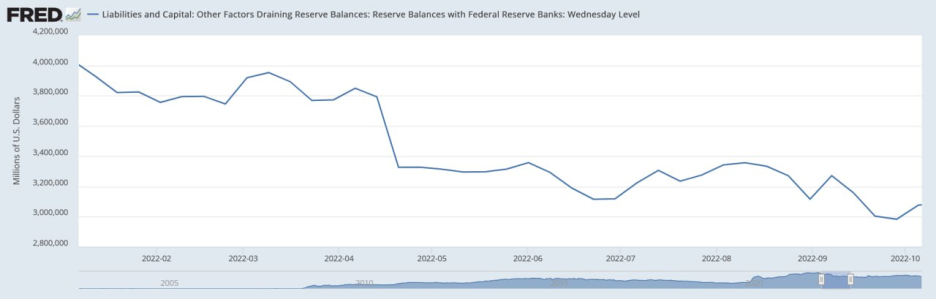
Reserves, Mar–Oct 2022
The reserve drain fed through to the April equity decline.
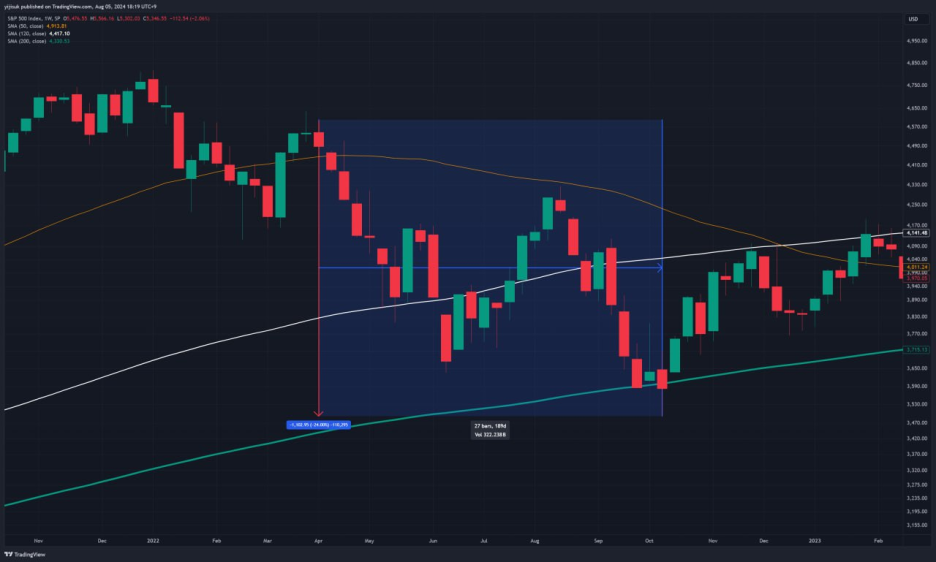
S&P 500, Mar–Oct 2022
2. October 2022–February 2023 (RRP → Treasury Bills)
Conclusion first: as hikes steepened, the market preferred T-bills, and the liquidity stacked in RRP rotated into bills. Two pieces of background before the walk-through.
(1) QE / QT through the liquidity-metrics lens
Under QE:
- Buy Treasuries → hold in SOMA → at maturity, roll over (rather than asking Treasury to redeem, buy an equal amount in the market to keep SOMA holdings flat) → reserves rise.
ΔReserves ↑ = ΔSOMA ↑ + ΔLending facilities − ΔTreasury TGA − ΔRRP
Under QT:
- At SOMA maturity, do not roll over; ask Treasury to redeem → Treasury issues new debt to fund redemption → new issuance moves market liquidity into the TGA → Treasury redeems with the Fed.
ΔReserves ↓ = ΔSOMA + ΔLending facilities − ΔTreasury TGA ↑ − ΔRRP
(2) T-bills vs the RRP rate
The RRP rate is set by the Fed as the lower bound of the policy band, whereas T-bill yields are set by market supply/demand and pre-price the expected path. The faster the market expects the Fed to hike, the more T-bill yields rise above the RRP rate — on the expectation of a higher yield later.
Back to the timeline: this was pronounced between October 2022 and February 2023. The hiking pace ran faster than the market expected, and institutions used RRP balances to buy Treasury-issued bills. The Treasury issued a massive volume of bills in this window. The chain:
Bill supply ↑ → bill price ↓ → bill yield ↑ → expectation of higher short rates
→ RRP cash rotates into bills → into the Treasury TGA
→ reserves ↑ via fiscal outlays and Treasury redemptions (TGA drawn down)
ΔReserves ↑ = ΔSOMA ↓ + ΔLending facilities − ΔTreasury TGA ↓ − ΔRRP ↓
From late 2022 into early 2023 the RRP balance bled down while reserves rose choppily.
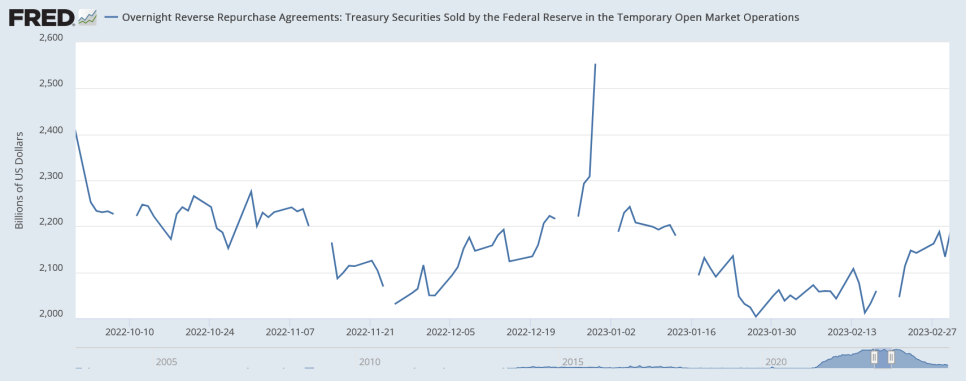
RRP, Oct 2022–Mar 2023
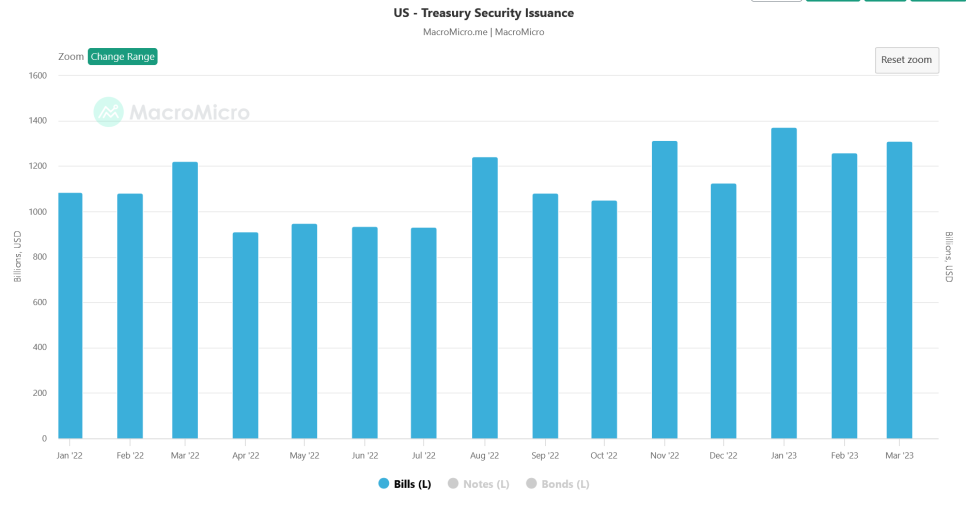
Treasury bill issuance, Oct 2022–Mar 2023
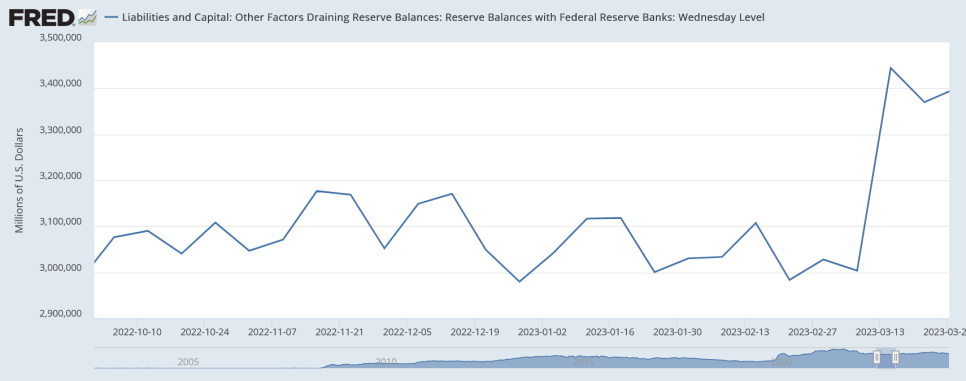
Reserves, Oct 2022–Mar 2023 — the drain slowed despite QT
3. March–June 2023 (The Fed's all-fronts liquidity injection)
Summary: a Fed liquidity injection to contain the spread of the regional-bank failure crisis.
March 2023, Silicon Valley Bank (SVB) failed. It had invested most customer deposits in long-dated Treasuries; the sharp hikes crushed their prices. It could not meet withdrawal demands, a run ensued, and it failed. The Fed's response:
- Lend to banks against Treasury collateral valued at par (the issued face value, not the depressed post-hike market price).
- Liquidity support via the Bank Term Funding Program (BTFP).
ΔReserves ↑ = ΔSOMA ↓ + ΔLending facilities ↑ − ΔTreasury TGA − ΔRRP
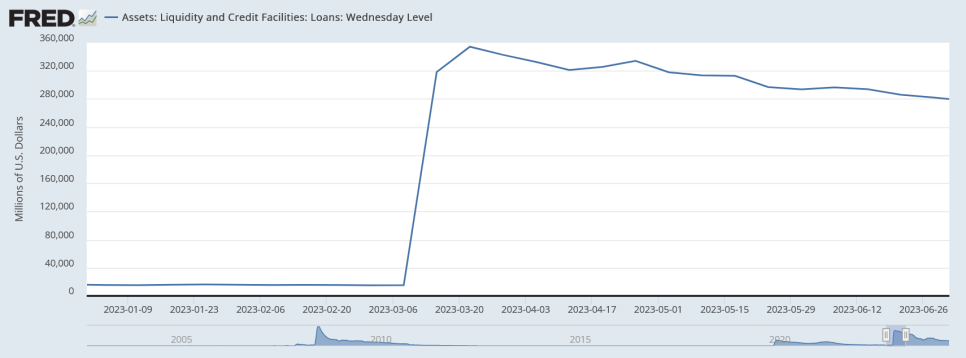
Fed lending facilities, Mar–Jun 2023
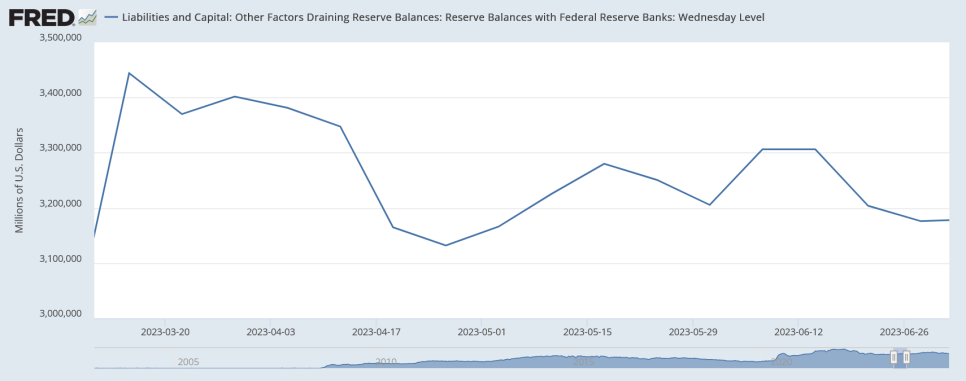
Reserves, Mar–Jun 2023 — the contraction slowed despite QT
4. July 2023–March 2024 (RRP → Treasury Bills)
Ahead of the July 2023 debt-ceiling negotiation, the Treasury had run the TGA nearly to zero for negotiating leverage. Right after the deal, Yellen ramped bill issuance sharply to refill the TGA, and from July to October 2023 market liquidity tightened into a correction.
From H2 2022 through H1 2023 the Treasury had steadily drained the TGA via fiscal outlays, supplying liquidity to the market.
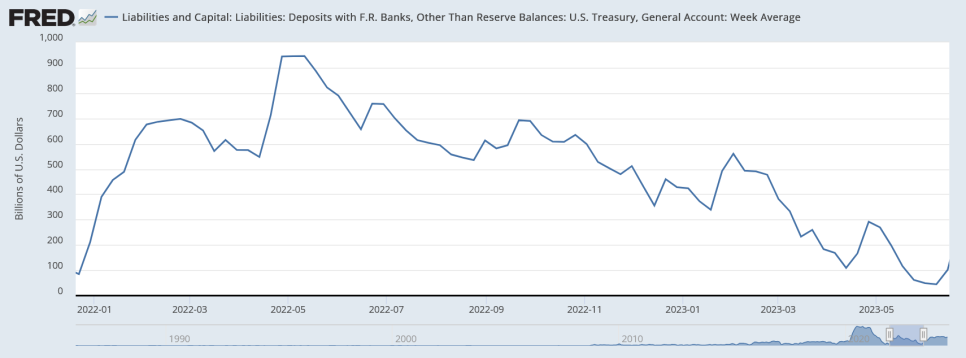
TGA balance, Jan 2022–Oct 2023
Right after the debt-ceiling deal, the Treasury refilled the TGA with an even larger volume of bill issuance,
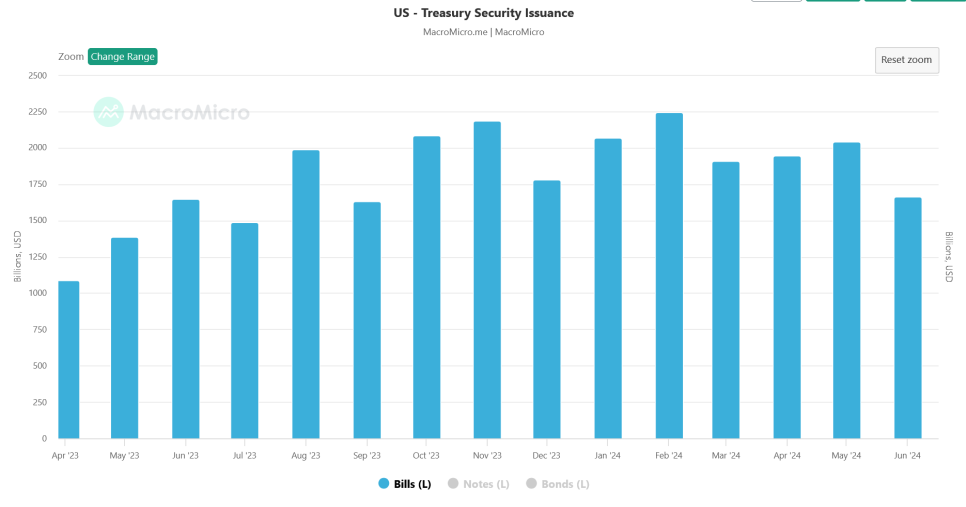
and market liquidity was absorbed into a correction over the period.
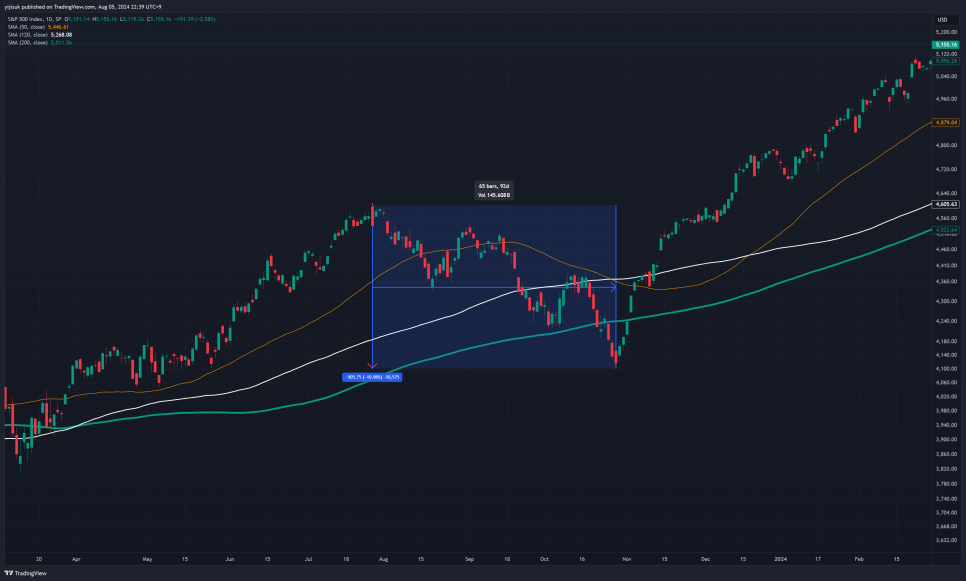
S&P 500, Jul–Oct 2023
Rising bill supply pushed bill yields above the RRP rate, and RRP cash flowed into the TGA.
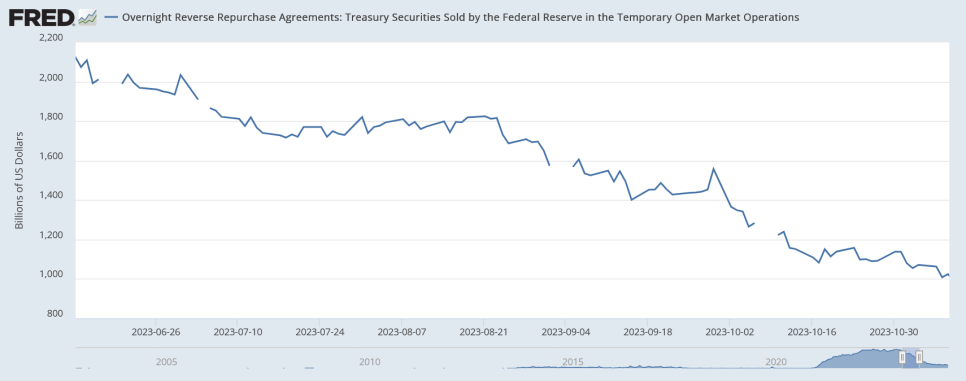
RRP, Jul–Oct 2023
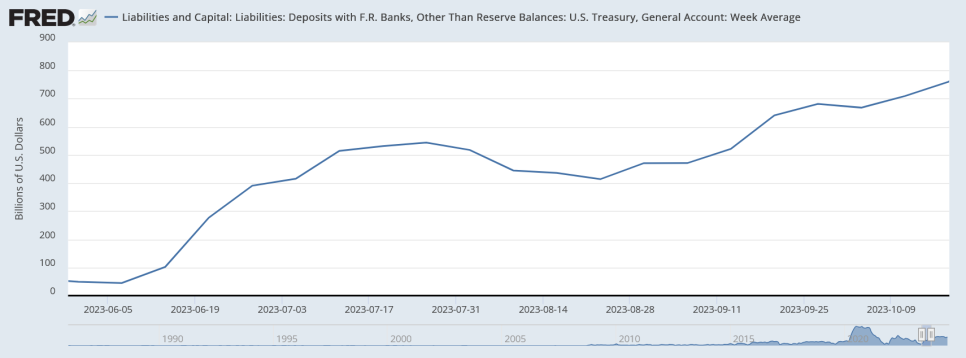
TGA balance, Jul–Oct 2023
From November 2023 the Treasury released the absorbed liquidity modestly, and despite the Fed's QT, system liquidity rose into Q1 2024.
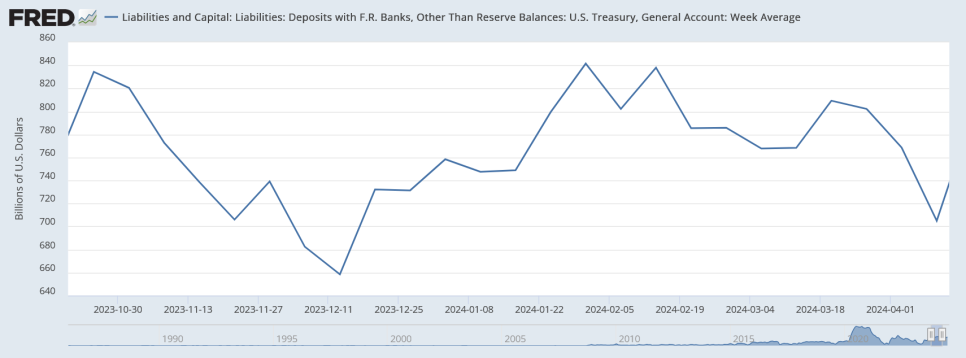
TGA balance, Nov 2023–Apr 2024 (declining)
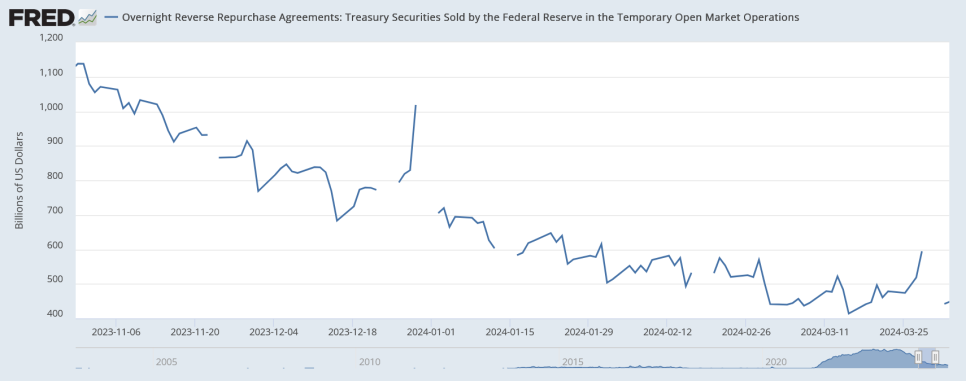
RRP, Nov 2023–Apr 2024 (declining)
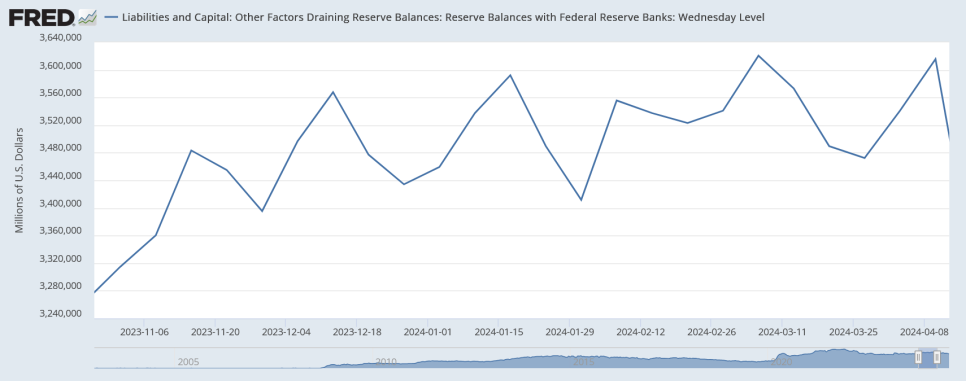
Reserves, Nov 2023–Apr 2024 (modest rise)
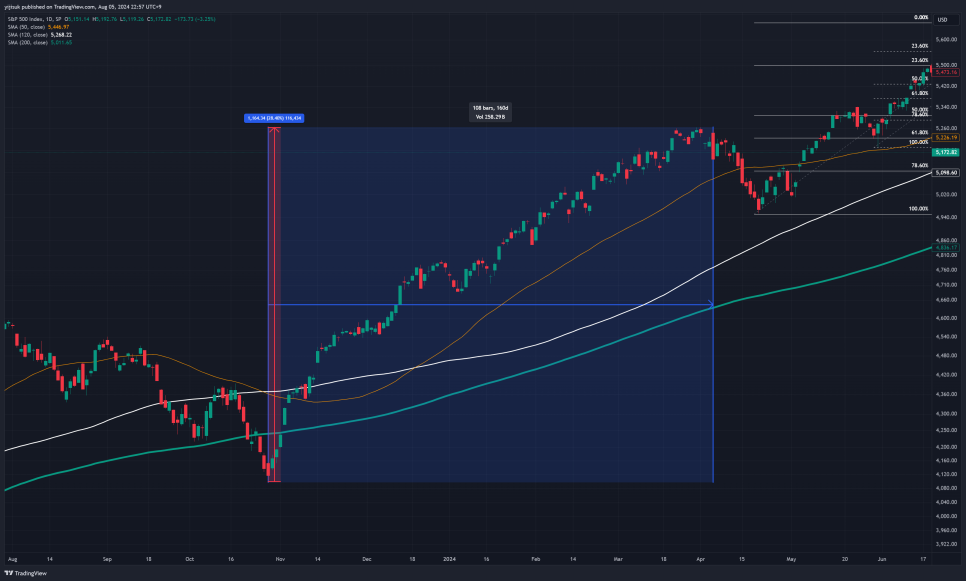
S&P 500, Nov 2023–Apr 2024 (rising)
ΔReserves ↑ = ΔSOMA ↓ + ΔLending facilities − ΔTreasury TGA ↓ − ΔRRP ↓
In sum, over this window Yellen used bill issuance to pull liquidity out of RRP and refill the TGA while holding reserves roughly level and nudging them modestly higher.
5. Q3–Q4 2024 (Where it stands)
Until then, in line with QT, the RRP balance had fallen steadily and fed the market through the TGA, keeping reserves roughly level. From Q2 2024, however, QT continues while the other accounts hold — so reserves are now in sustained decline.
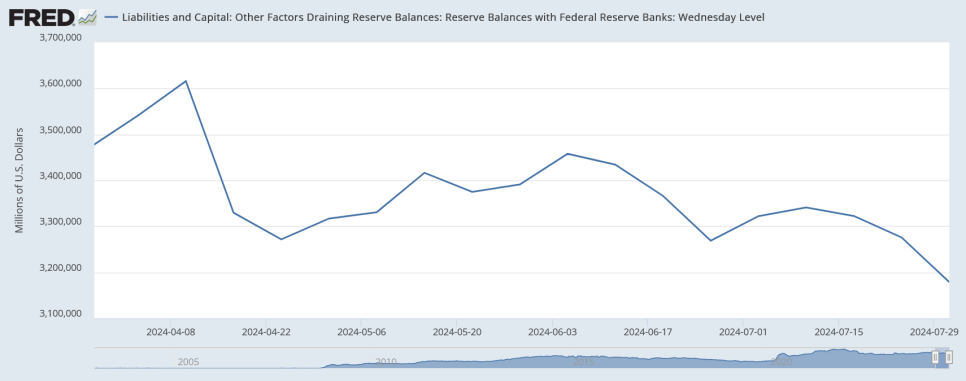
Reserves since April 2024
ΔReserves ↓ = ΔSOMA ↓ + ΔLending facilities − ΔTreasury TGA − ΔRRP
If this persists it is a major risk to market liquidity. The concrete Q3/Q4 2024 scenarios are taken up in Part 3.