Taking the Liquidity Temperature Pt. 3 | Scenarios
Part 2 established that reserves have been in sustained decline since Q2 2024. Part 3 sets the H2 2024 scenario, metric by metric.
Summary:
- SOMA: keeps falling on continued QT.
- Lending facilities: possible early BTFP repayment within four months.
- RRP: likely drawn to fund the Treasury's Q3 TGA build.
- Treasury TGA: up in Q3, down via outlays in Q4.
1. Lending Facilities — Early BTFP Repayment
In the SVB episode the Fed supplied liquidity by lending to banks against collateral through BTFP and similar facilities. That collateralized lending must eventually be repaid, and on repayment bank reserves fall and system liquidity deteriorates.
The point to watch is the scope for early BTFP repayment. A September Fed cut was all but locked in, and market rates had fallen below the rate at which BTFP loans were originally drawn. Since BTFP carries no early-repayment penalty, banks have an incentive to repay early and re-borrow at the lower rate. The lower market rates go, the more early BTFP repayment accelerates.
The size:
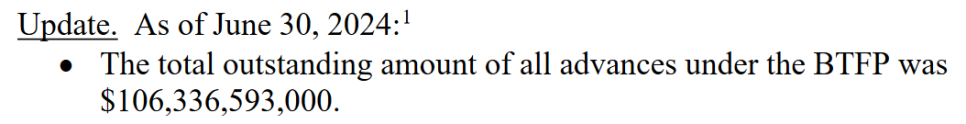
- BTFP balance in the latest report ≈ $106B.
- Current Fed QT pace is $25B/mo + ~$15B/mo of liquidity absorbed via MBS prepayments → effective QT ≈ $40B/mo.
- The BTFP balance is roughly four months of QT — not negligible.
- BTFP closed in March 2024 with a one-year maturity — banks must finish repayment before March 2025.
- A September cut (or an earlier one) accelerates early repayment.
So over the next six months, roughly four months' worth of QT-equivalent liquidity is set to be absorbed on top.
ΔReserves ↓ = ΔSOMA ↓ + ΔLending facilities ↓ − ΔTreasury TGA − ΔRRP
- ΔSOMA ↓: ongoing.
- ΔLending facilities ↓: modestly underway, with scope to accelerate.
That leaves the other two accounts (RRP, TGA) to offset the drain. Fortunately the signals are there.
2. RRP and the Treasury TGA — Reading the QRA
The offset signal shows up in the Treasury's QRA (Quarterly Refunding Announcement), which details the debt-issuance plan.
(1) QRA-reading background
Each quarter's QRA is released in two parts.
- Part 1: how much additional debt the Treasury issues and how it shifts the TGA balance.
- Part 2: the maturity distribution of the issued debt.
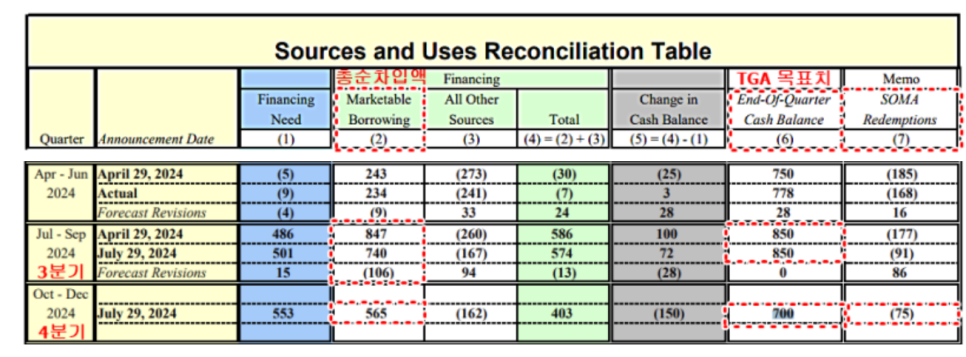
Column definitions in the Part 1 QRA table:
- Financing Need: total funds the government needs that quarter.
- Marketable Borrowing: funds to be raised via marketable issuance.
- All Other Sources: funds raised by non-marketable means.
- Total = Marketable Borrowing + All Other Sources.
- Change in Cash Balance: the gap between total funding and actual need. (+) raises the funding estimate, (−) lowers it.
- End of Quarter Cash Balance: the Treasury's TGA target for the quarter.
- SOMA Redemptions: Fed-held assets not reinvested (amounts owed back to the Fed under QT).
(2) The Q3 2024 QRA
Q3 2024 QRA, Part 1
Q3 2024 QRA, Part 2
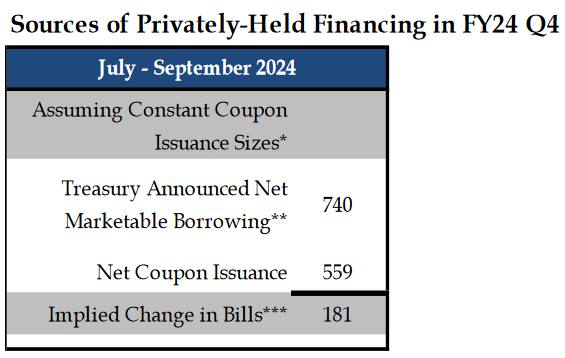
Per the Q3 2024 QRA released in late July:
- Of $740B Q3 Marketable Borrowing, $559B (75.5%) is to be raised via coupons and $181B (24.5%) via T-bills.
- The Q3 End-of-Quarter Cash Balance (TGA target) rises from $778B to $850B, +$72B — absorbing liquidity to fill the TGA.
- The Q4 target is $700B — falling from $850B to $700B implies ~$150B of liquidity supplied within Q4.
Inference:
- Q3 reserves are static / gradually declining depending on variables.
ΔReserves ↓ = ΔSOMA ↓ + ΔLending facilities ↓ − ΔTreasury TGA ↑ − ΔRRP ↓
- From Q4, as the TGA is drawn down, liquidity is supplied and reserves rise.
ΔReserves ↑ = ΔSOMA ↓ + ΔLending facilities ↓ − ΔTreasury TGA ↓ − ΔRRP
(3) The issuance schedule
Per the press release, coupon issuance is broadly flat month-to-month across Q3.
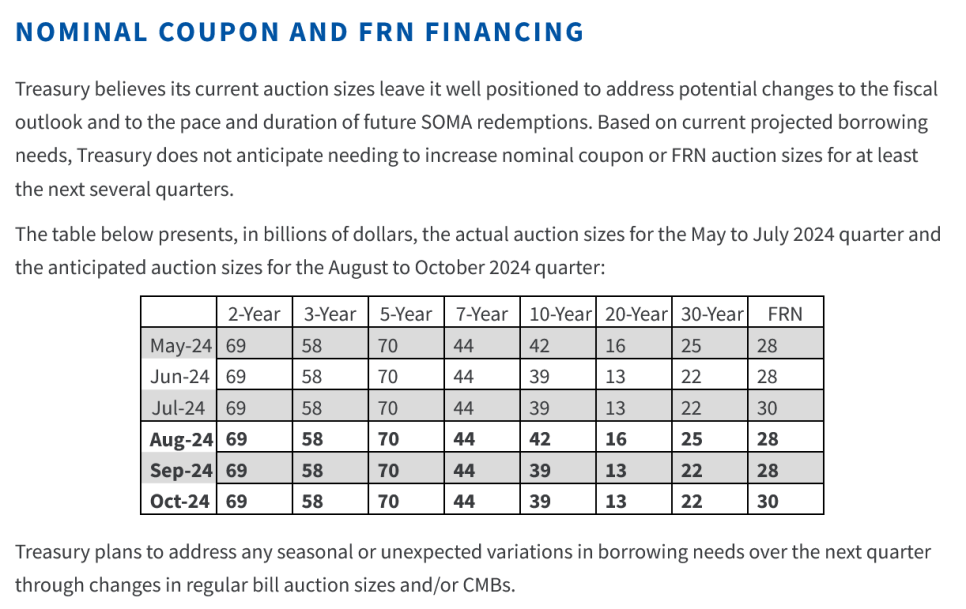
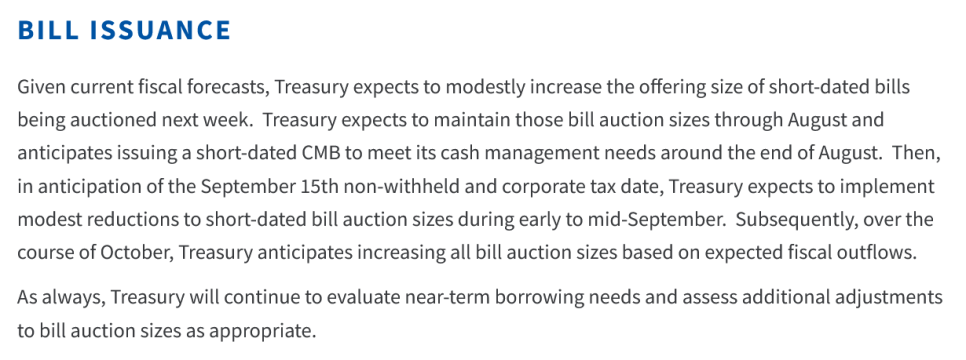
T-bills:
- July and August at the same pace.
- September is tax season — issuance trimmed.
- October — issuance ramps again.
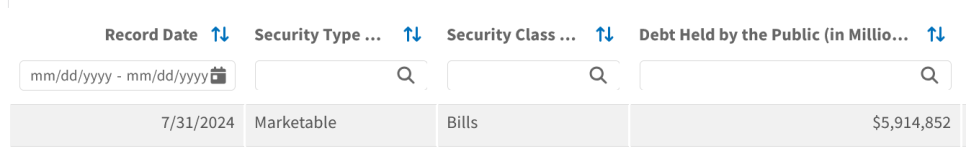
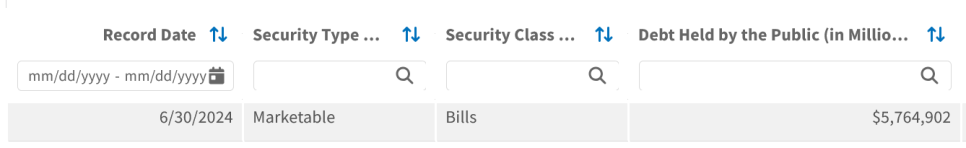
Estimating monthly bill issuance: the Q3 bill funding target is $181B. The Treasury already issued ~$150B in July (table difference: $5,914,852M − $5,764,902M = $149,950M).
Remaining issuance capacity ≈ $31B ($181B − $150B). Bills issued so far in August ≈ $16B ($160,989M + $70,002M − $215,006M = $15,985M).
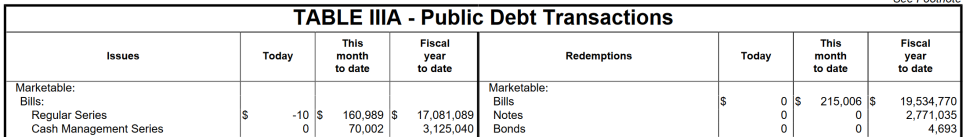
So additional bill issuance possible ≈ $15B ($31B − $16B). Early August with September still ahead, the bill-issuance runway is nearly exhausted.
In short, little Q3 bill issuance remains, and September (tax season) trims it further — so bills, the thing carrying liquidity, shrink into Q3, especially September: a negative signal for market liquidity.
But taken together — (i) bill issuance re-ramps from October, (ii) September tax receipts refill the TGA, (iii) Q4 brings a full liquidity release — the Treasury's intent to actively supply liquidity via TGA release + higher bill issuance is visible.
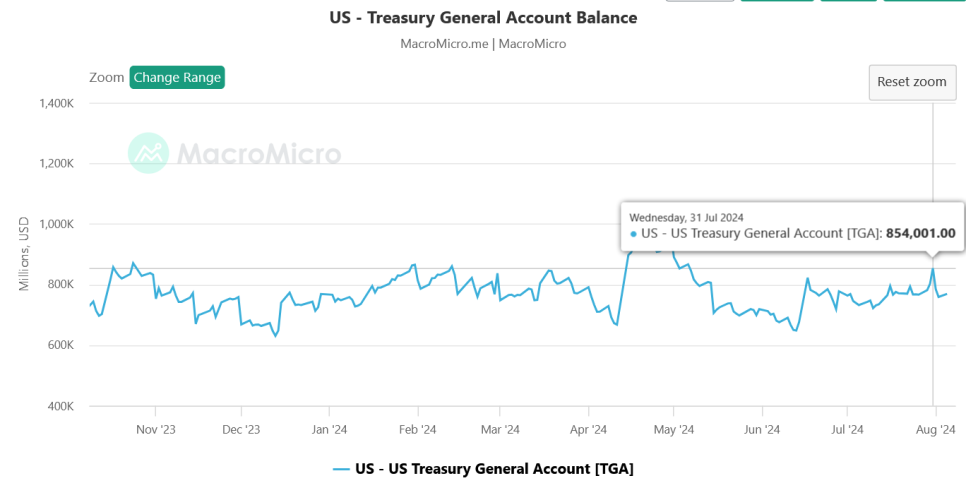
Recall the Q3 TGA target of $850B: the Treasury had already filled $854B by July 31.
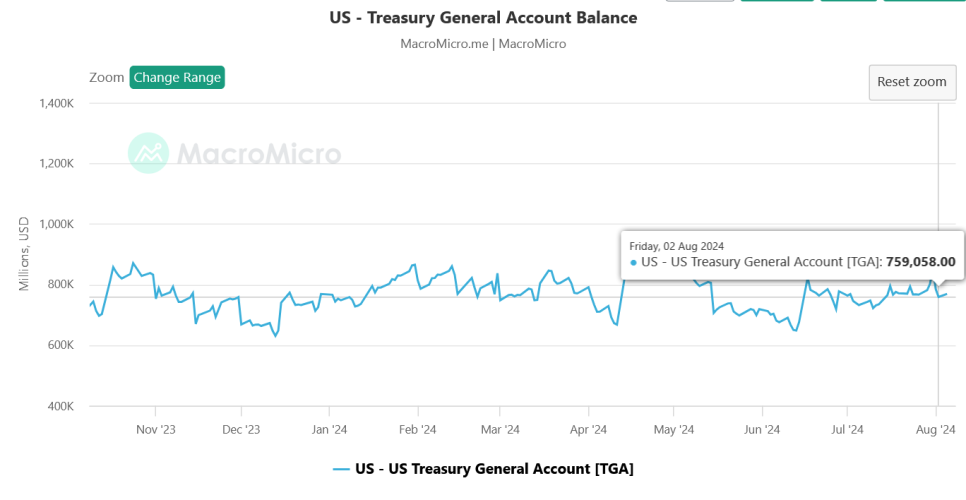
By August 1 the TGA fell to $759B — a clue that the Treasury is releasing liquidity modestly and managing market liquidity.
3. Balance and Conclusion
The Treasury's Q3 posture is to hold at a level that does not put strong upward pressure on equities, then release liquidity in earnest in Q4. The balance of absorption vs injection:
Absorption:
- Fed QT $25B/mo + MBS prepayments ~$15B/mo → effective QT ≈ $40B/mo.
Injection:
- Bill issuance ramping in earnest from Q4.
- TGA drawdown via fiscal outlays.
- The Treasury's ongoing buybacks (early redemptions).
At least into the election, the injection factors that buoy the market dominate. The Treasury is visibly putting everything into supporting equities ahead of the election; the real question is the post-election setup — taken up later.