Fundamental Check, Jul 29-Aug 2 2024

1. Recap of Last Week
July 22–26, 2024: US equities corrected as Tesla and Google — the first of the Magnificent 7 to report — fell short of expectations. Tesla missed; Google beat Street estimates but fell on declining YouTube ad revenue. Detailed earnings analysis in last week's note.
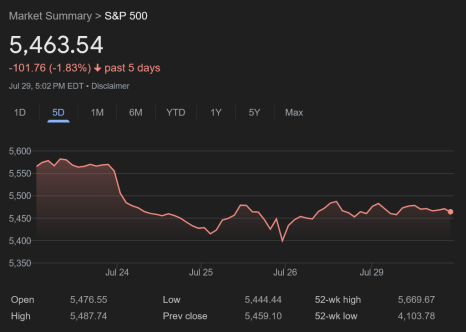
- S&P 500: down ~5% from the high, then a 2% bounce off the 50-day MA.
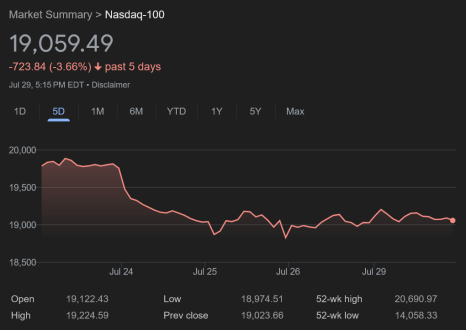
- Nasdaq 100: down ~9.3% from the high, then a 2% bounce in the May congestion zone.
- Broadly a week of tech-led correction.
2. The View for Jul 29–Aug 2
Conclusion first: from a bird's-eye view the leadership's underlying earnings are solid; this is a temporary correction / breather. The market rose relentlessly for ~3 months from mid-April to mid-July, so some rebalancing is due. The current short-term narrative is carried by correction sentiment:
- AI-profitability concern (heavy CAPEX, uncertain revenue).
- Big-tech earnings short of expectations.
- Election uncertainty and the Trump trade.
Keep rebalancing and unpredictable volatility in mind; playing the big picture beats short-term directional bets.
(1) The S&P 500's Overall Fundamentals
Per FactSet's S&P 500 Earnings Season Update (2024-07-26), the share of companies reporting positive surprises is above the historical average, but the magnitude of the surprises is below average. Statistically, 41% of the S&P 500 has reported and 78% beat EPS estimates — vs the 5-year average of 77% and 10-year average of 74%, Q2 is above the historical average.
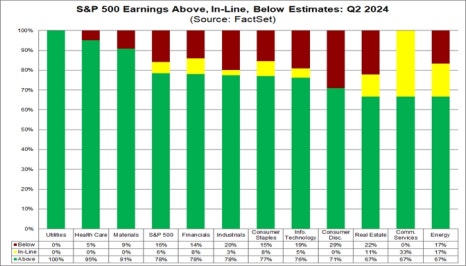
A majority of companies across S&P 500 sectors reported Q2 revenue / earnings surprises.
"On the other hand, the market is rewarding positive EPS surprises reported by S&P 500 companies less than average and punishing negative EPS surprises reported by S&P 500 companies more than average."
The market is currently reacting more sensitively to EPS misses than to beats — a short-term swing only. The optimal entry zone is amid skepticism. Liquidating into pessimism hands someone else the low.
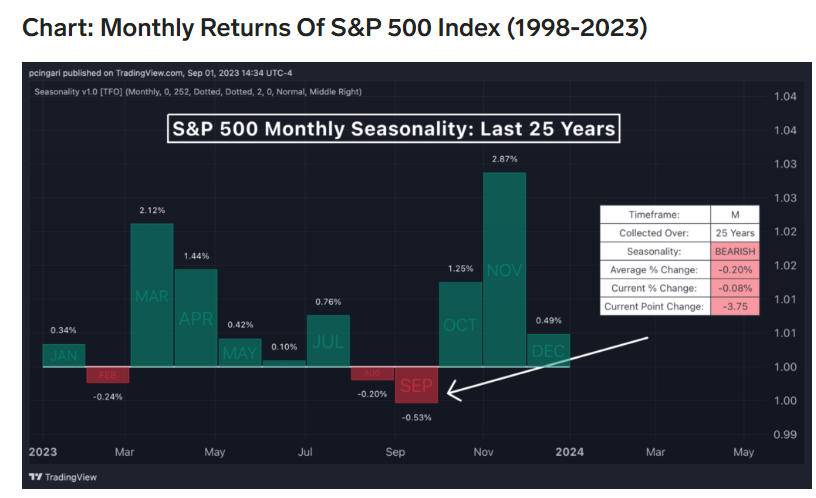
August and September are, historically, low MoM-performance months for the S&P 500 — there is always a reason for a correction somewhere around then. In July the S&P 500 fell ~2% and the Nasdaq 100 ~3%; the possibility that the Aug–Sep correction was pulled slightly forward into July can't be ruled out.
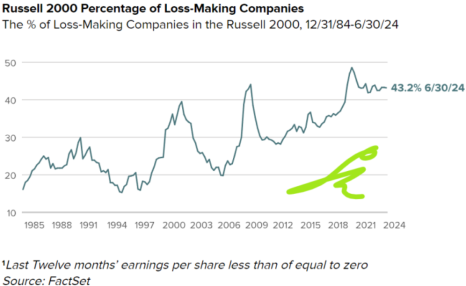
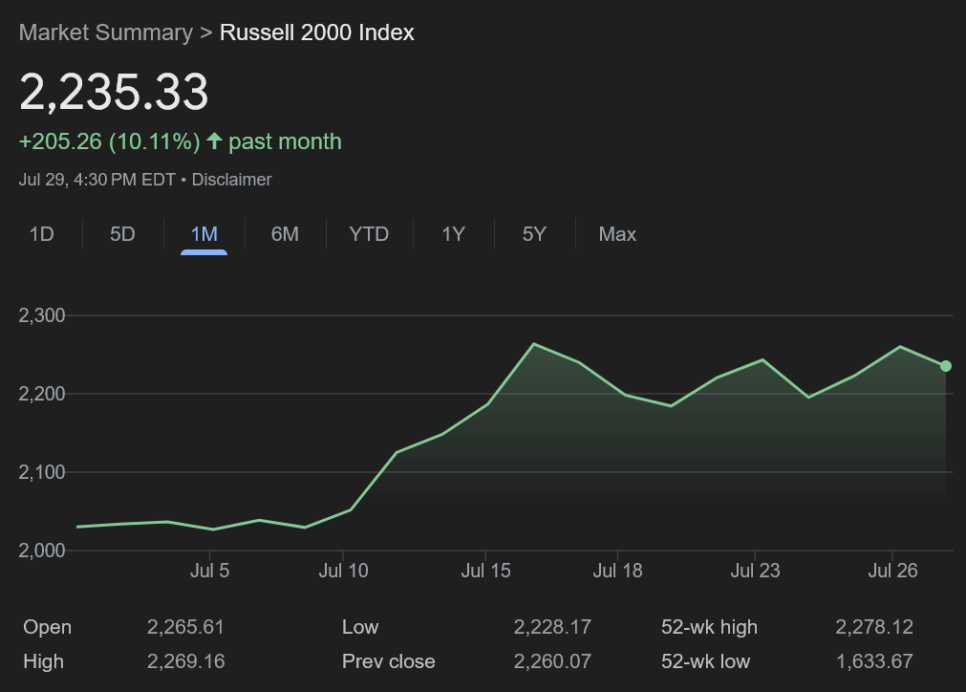
(2) Rebalancing Fundamentals — Russell 2000
While the S&P 500 and Nasdaq 100 fell on aggregate over July 22–26, the small-cap Russell 2000 rose 3–4% on the week — the rally continued, pricing a September cut. Why is a lower policy rate positive for small caps? The debt composition of Russell 2000 vs S&P 500 companies explains it.
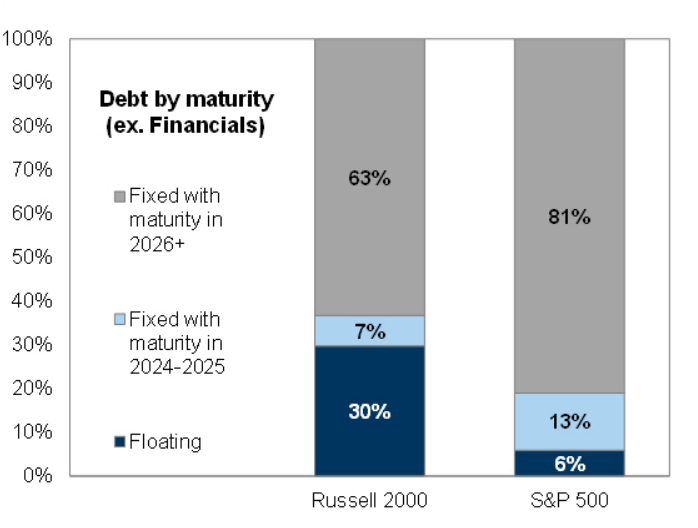
The point of comparison is the floating-debt share.
"Floating debt is more sensitive to interest rate changes. The Russell 2000 has a significantly higher proportion of floating rate debt compared to the S&P 500, indicating potentially higher exposure to interest rate fluctuations."
Financially weaker Russell 2000 companies have a higher short-term debt-issuance ratio than the S&P 500, so they are more sensitive to short-term market rates. With M7-centric trades running for so long, this is the unwinding of that concentration.
Long term, value appreciation must be underpinned by earnings growth. Can liquidity supply to the Russell 2000 persist? I don't think so — these firms are not financially sound and on average do not show earnings growth.
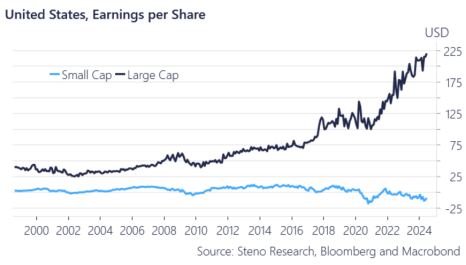
- (left) Across 2020–2024 large caps showed ~2x average EPS upgrades; small caps showed an EPS decline instead.
- (right) The Russell 2000's loss-making-company share keeps rising.
That said, "Going back to 1979, anytime the Russell 2000 posted a monthly gain of 10% or more, it was higher 90% of time six months later with an average gain of roughly 11.5%" (Bloomberg) — so the inflow trend does not necessarily snap immediately.
Fundamentally, the Russell 2000's move is momentum, not fundamentals — not to be overlooked — but as a short-term trade it looks worth playing.
3. Key Calendar This Week
A very important week.
| Date | Economic | Earnings (proxy for) |
|---|---|---|
| 7/29 (Mon) | Dallas Fed Mfg Index | $MCD (pre-open) — consumer sentiment |
| 7/30 (Tue) | Consumer Confidence, June JOLTS | $MSFT·$ANET·$AMD (after close) — AI profitability (SW / infra / semis), $SBUX — consumer sentiment |
| 7/31 (Wed) | July FOMC | $META (after close) — AI profitability & ad demand, $ARM — AI profitability (semi enablers) |
| 8/1 (Thu) | July ISM Manufacturing | $AAPL (after close) — mobile demand, $AMZN — e-commerce & AI infra |
| 8/2 (Fri) | $XOM·$CVX (pre-open) — energy sector & global-economy fundamentals |
4. Synthesis
The market is at the last line of a correction. The flow resembles the S&P 500's 10% correction from late July through October 2023. Where last year entered a correction citing economic / rate uncertainty, if a July–September correction plays out this year the market will pin it on election uncertainty / the Trump trade and the resulting valuation revisions among major market players.
I don't expect a fast break to new highs, but since last week's drop the market has been bouncing modestly amid uncertainty. What decides the "size of that bounce" is the rest of the big-tech and key AI-enabler earnings this week.
I view all of this as short-term noise. If a correction comes it is a time to add, not to liquidate and run. Whatever the case, it is a time to secure cash low-risk (on both the upside and downside).