Valuation Check, Jul 29-Aug 2 2024

The previous Fundamental Check gave an overview of the underlying earnings of the S&P 500 / Nasdaq 100 leaders. Now it is time to look at valuation. Fundamentals and valuation are correlated, but solid fundamentals do not automatically produce a defensible valuation. Fundamentals indicate profitability and growth; valuation tests whether the current corporate value is explainable given past and present profitability and growth. However profitable a company is, if the market value is high it is best avoided.
1. Magnificent 7
(1) Preface — DCF Modeling
The Magnificent 7 led 2024. They earned the "true AI winner" title, but it is also true the market awarded a high valuation, justified as "AI is the food of future industry." From H2, however, AI-profitability skepticism began circulating. From Google's and Microsoft's recent results, the Street's stance is: AI enablers (cloud) show enormous margins and growth, but their own in-house AI SaaS only raises CAPEX while real profitability conversion is ambiguous.
When CAPEX rises:
- FCF can fall even as net income grows, or
- Higher depreciation (server-infra investment) can reduce net income / EPS.
"Can the valuation given in early 2024 still be justified now?" — the core question.
DCF (Discounted Cash Flow) modeling, the most common approach, applies staged projections based on net-income (EPS) or FCF growth assumptions:
- Steep early-growth n years: p% growth p.a.
- Stabilized m years: a steady q% p.a.
- Discount the net income / FCF of both periods to present value to value the company.
EPS-based DCF centers on equity valuation (simpler, but EPS is manipulable). FCF-based DCF evaluates total cash flow and financial health (cash is the hard-to-manipulate final metric, so results are more reliable). For franchise-established firms like the Mag7, future EPS / FCF are estimable, so DCF outputs are somewhat reliable. Here I briefly compare each Mag7's EPS / FCF fair-value estimates with Street targets to answer "can the current market value be justified." Not a precise calculation — a "just taking the temperature" approach; for reference only.
2. Alphabet ($GOOGL)
(1) EPS-growth DCF fair price
(source: GOOGL financials spreadsheet, own)
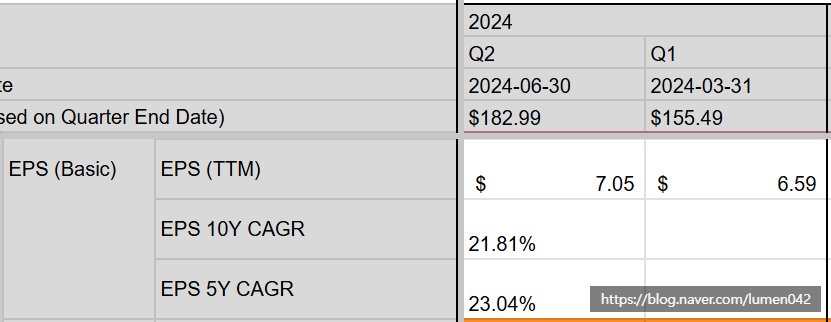
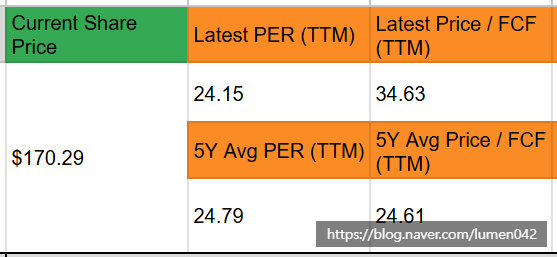
On TTM (Trailing Twelve Months) EPS through Q2 2024 (fiscal), 10y / 5y EPS CAGR: 21.81% over 10y, 23.04% over 5y. Assuming 20%+ EPS growth over the next 10y,
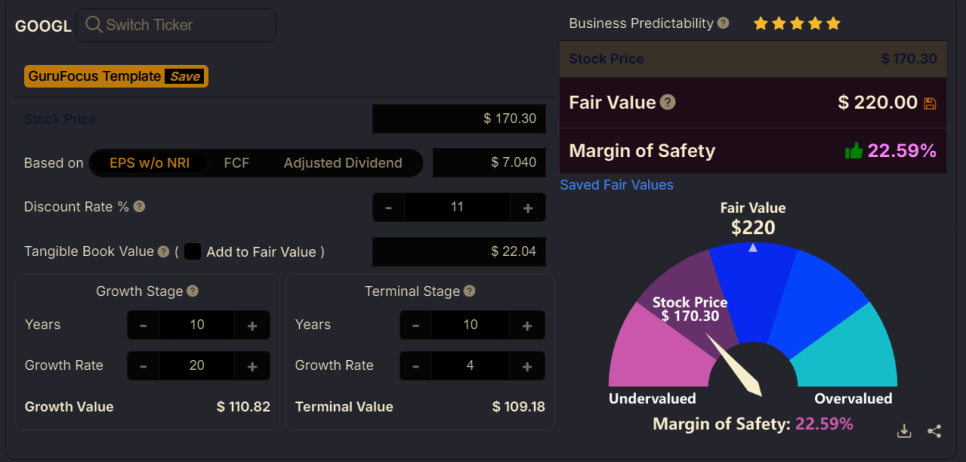
fair price assuming ~20% p.a. EPS growth (source: gurufocus)
Fair price $220 — ~22% upside from the current $170s.
(2) FCF-growth DCF fair price
(source: GOOGL financials spreadsheet, own)
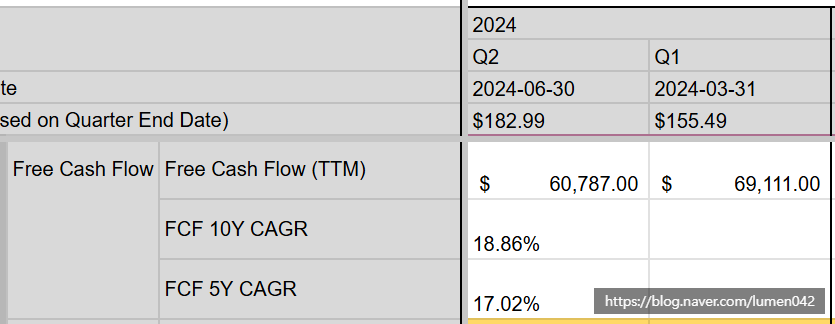
On TTM FCF, 10y / 5y FCF CAGR: 18.86% over 10y, 17.02% over 5y. Cash flow so far came from ads / cloud, not AI software. The big-tech calls hint at higher CAPEX for AI infra — so FCF growth must dip short term. Assumptions (layered — high uncertainty):
- First 5y: heavy cash CAPEX from infra investment, FCF growth trimmed to 15–17%.
- Next 5y: golden era, AI-SaaS share captured, FCF growth rises to 18–20%.
- Last 5y: decline, 10–15%.
- Final maturity: FCF growth 4%.
A Monte-Carlo simulation over these ranges:
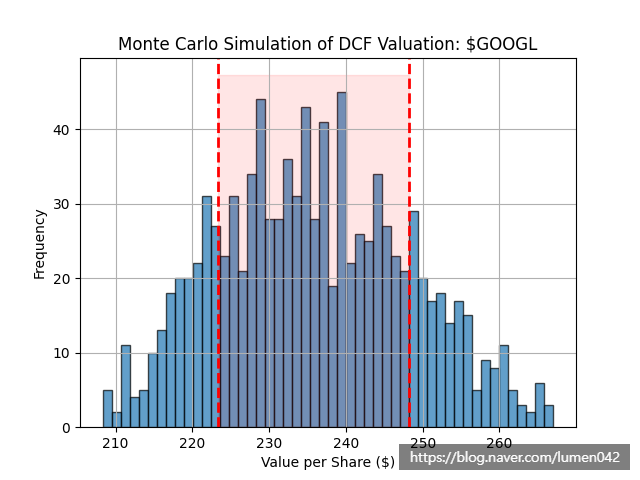
GOOGL fair-price distribution via Monte-Carlo simulation
Rounded, the stable range is $230–240 — vs the current $170, ~35–40% undervalued. ~30% undervalued on the EPS view, 35–40%+ on the optimistic long-run FCF view. Realistically, though, if AI-infra CAPEX yields no return and instead drags FCF growth (10y Growth Stage at 15–17% FCF p.a.):
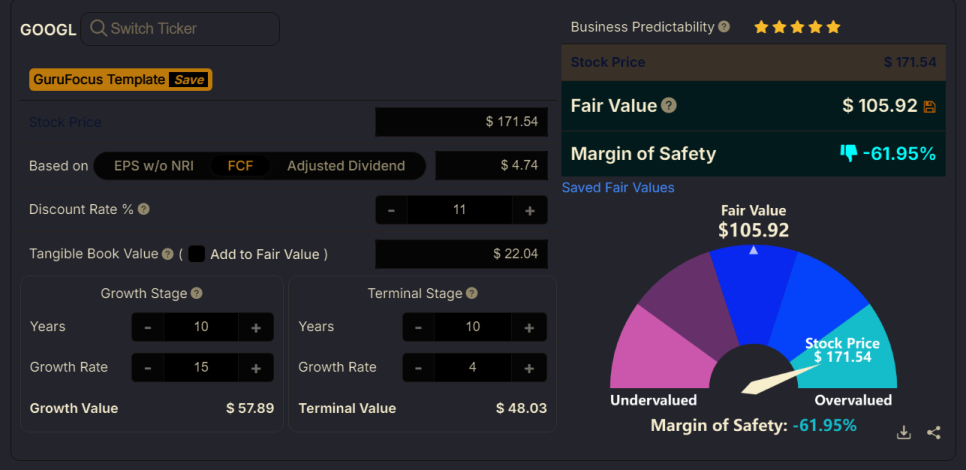
fair price assuming ~15% p.a. FCF growth (source: gurufocus)
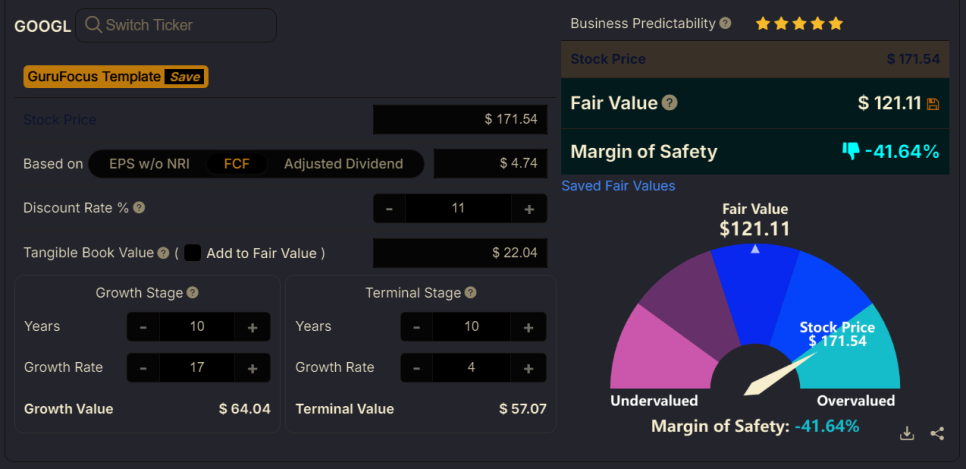
fair price assuming ~17% p.a. FCF growth (source: gurufocus)
In that case the current market price is meaningfully overvalued. The valuation distribution differs greatly by one's view of market / business growth — the crux is the investor's lens on the company.
(3) Street analyst averages
With fair-price polarization severe, the average estimate helps interpret (no guarantee of being right, but it shows the market's average expected price band).
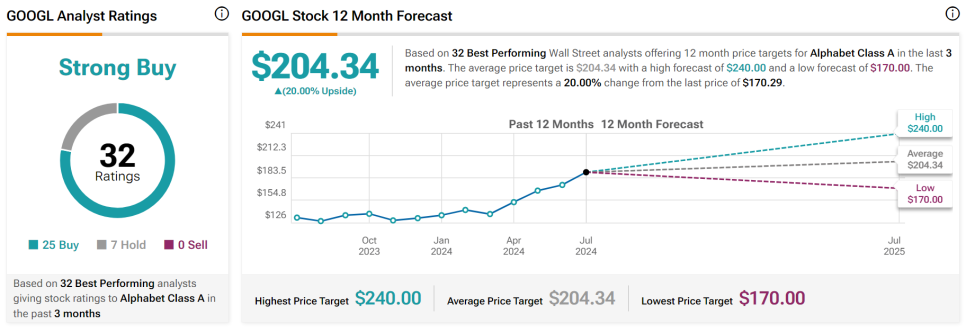
Street analyst average target $200s (source: TipRanks)
32 analysts' average target: $200s.
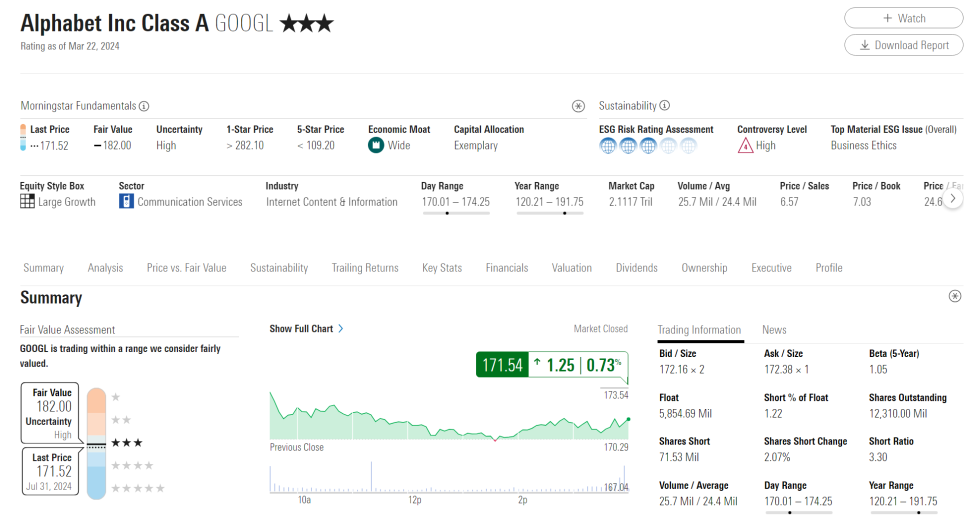
Morningstar fair value $182 (source: Morningstar)
Michael Hodel (Director) report (source: Morningstar)
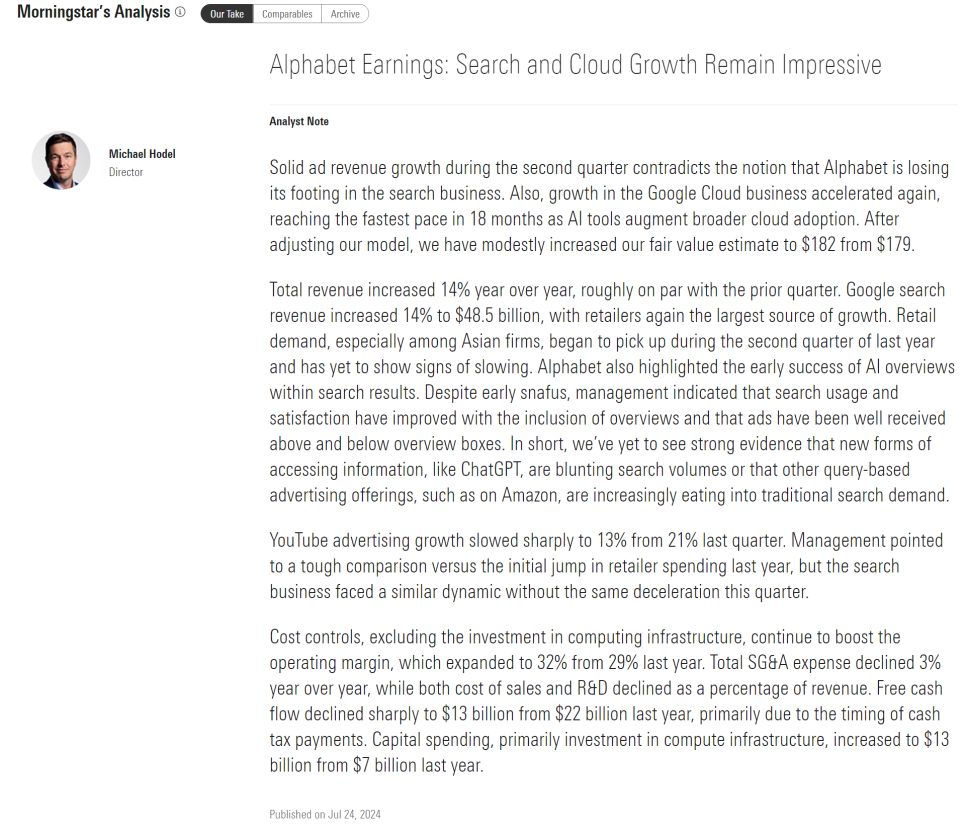
Summary: Google's traditional segments (ads, cloud) were strong, but the market response to its in-investment AI software (AI Search, etc.) is lukewarm. Concern that OpenAI's / Amazon's new AI search experiences could siphon some Google-search demand. Morningstar Hodel's fair value is $182 — currently slightly undervalued.
(4) Historical valuation ratios
The property of converging to fair value does not make fair value = market price. On the market-valuation lens (how the market has historically valued it):
(source: GOOGL financials spreadsheet, own)
- 5y-avg TTM-earnings Average PER 24.79, current PER 24.15 — slightly below the market average on PER.
- 5y-avg TTM-FCF Average Price/FCF 24.61, current 34.63 — above the market average on Price/FCF.
- Net income tracks the price; cash flow lags.
Net: the current $170s is undervalued vs EPS growth and market expectation, but on FCF growth realistically somewhat overvalued. Overall there is undervaluation potential and upside.
3. Microsoft ($MSFT)
(1) EPS-growth DCF fair price
(source: MSFT financials spreadsheet, own)
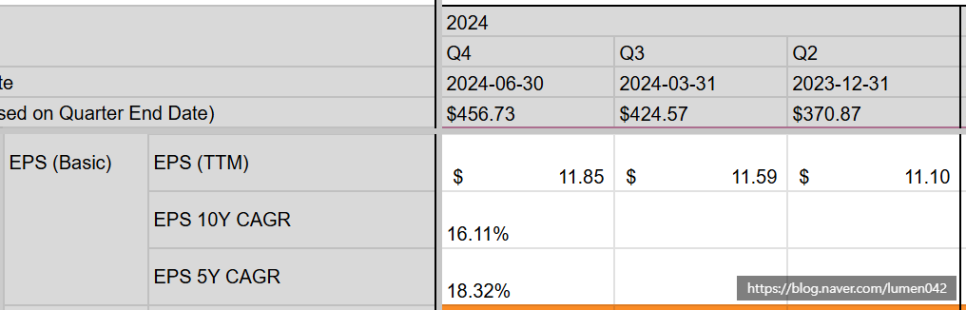
On TTM EPS through Q4 2024 (fiscal), 10y / 5y CAGR: 16.11% over 10y, 18.32% over 5y. Assuming 17%+ EPS growth over 10y,
fair price assuming ~17% p.a. EPS growth (source: gurufocus)
Fair price $295 — vs current $422s, ~43% overvalued.
(2) FCF-growth DCF fair price
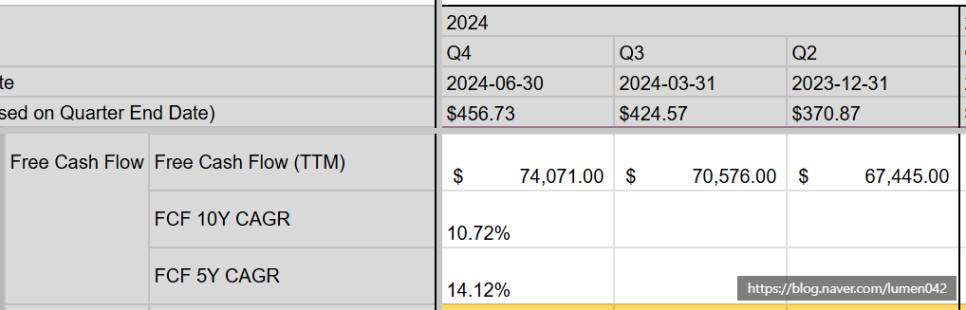
(source: MSFT financials spreadsheet, own)
On TTM FCF, 10y / 5y CAGR: 10.72% over 10y, 14.12% over 5y. Assuming 12%+ FCF growth over 10y,
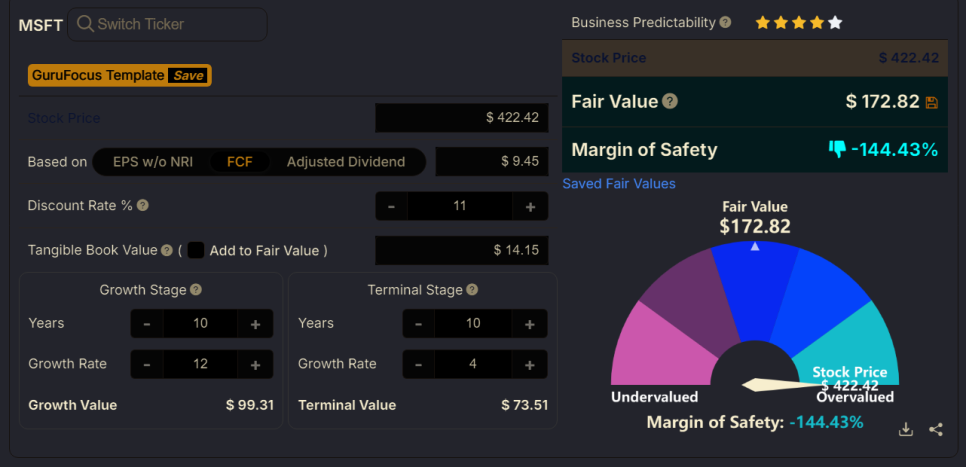
fair price assuming ~12% p.a. FCF growth (source: gurufocus)
Fair price $172 — vs current $422s, ~144% overvalued. 43% overvalued on EPS, 144% on FCF.
(3) Street analyst averages
With the market–fair-price gap large, the average estimate helps.
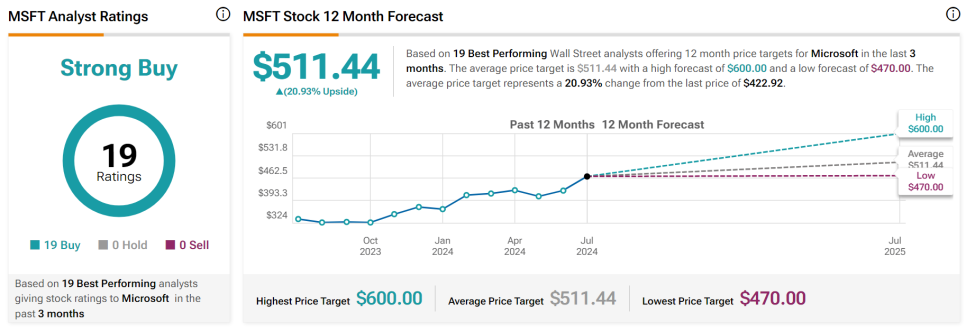
Street analyst average target $510s (source: TipRanks)
19 analysts' average: $510s — current price ~20% below target. Given MSFT holds the largest OpenAI stake and is a cloud leader, they appear to assign the AI potential to the target.
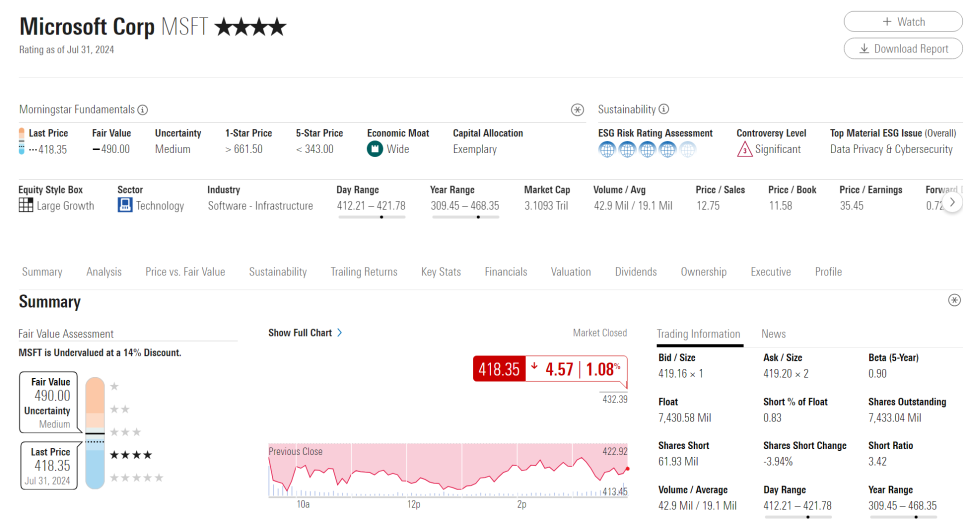
Morningstar fair value $490 (source: Morningstar)
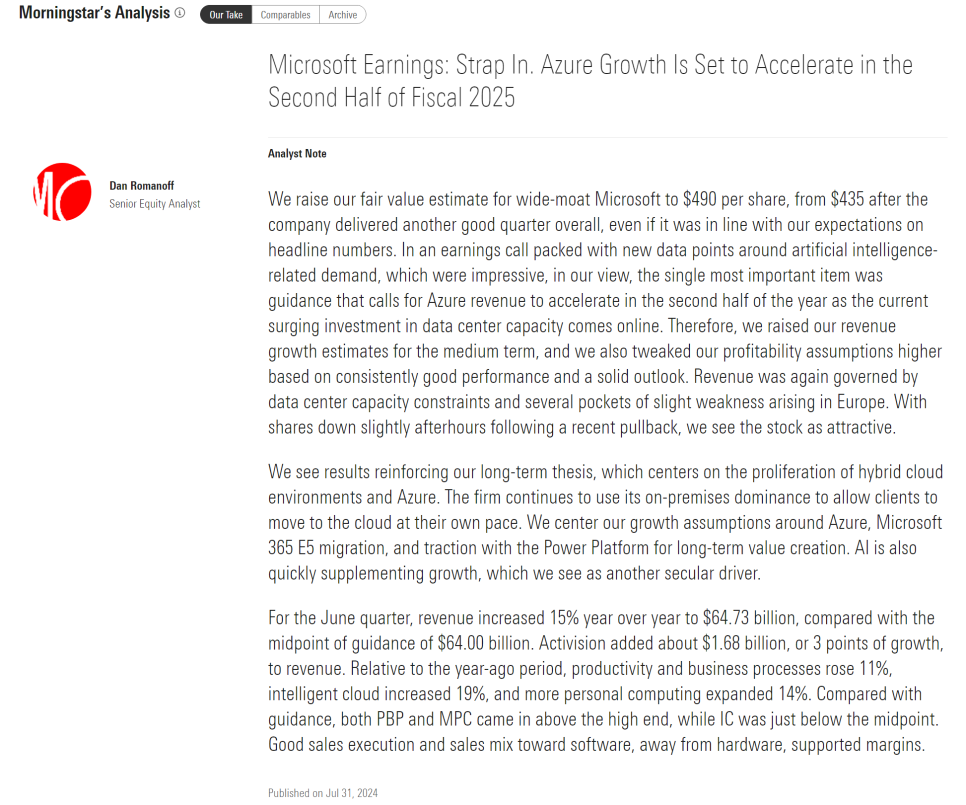
Dan Romanoff (Senior Equity Analyst) report (source: Morningstar)
Report summary: "MSFT's diversified business portfolio performed well and will continue to." Why analyst estimates differ so much from the DCF values: superficially, a bet on MSFT's AI infrastructure lifting future EPS growth. On EPS without non-recurring items (not GAAP), the recent 5y EPS growth is 22%.
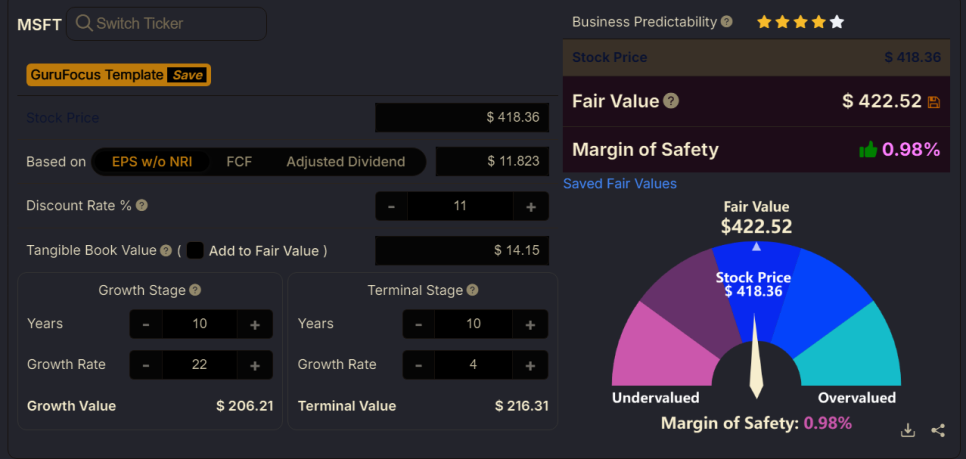
fair price assuming ~22% p.a. EPS growth (source: gurufocus)
Justifying the current price and adding a touch to 23–25%,
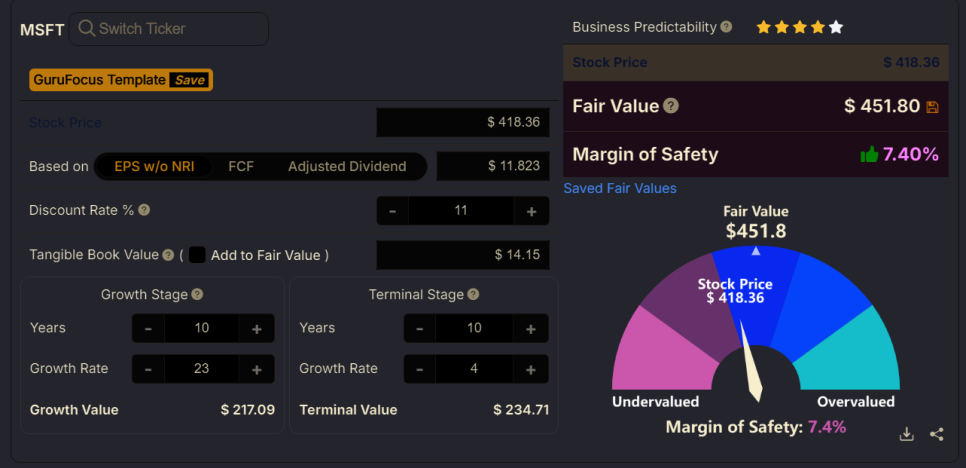
fair price assuming ~23% p.a. EPS growth (source: gurufocus)
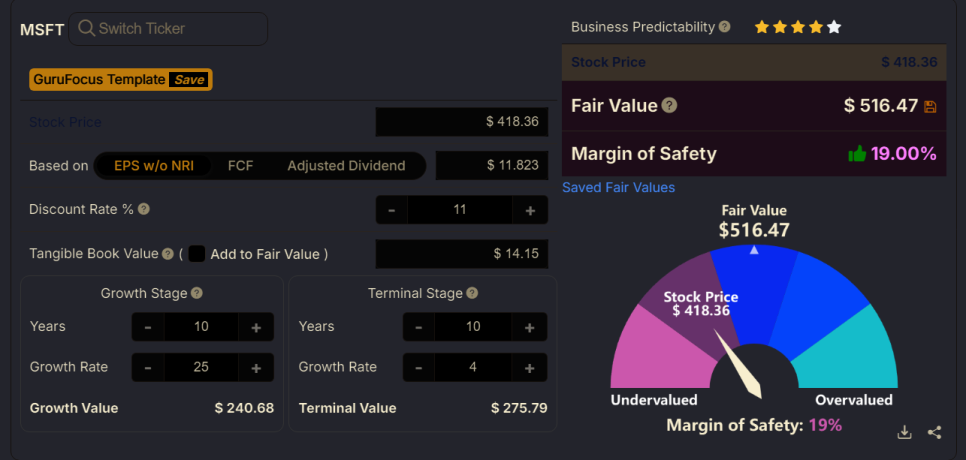
fair price assuming ~25% p.a. EPS growth (source: gurufocus)
A range similar to the analyst estimates results — the crux is the lens on market and company.
(4) Historical valuation ratios
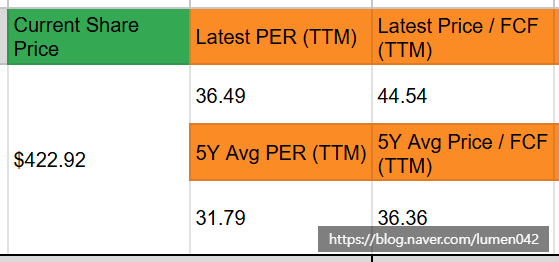
(source: MSFT financials spreadsheet, own)
- 5y-avg Average PER 31.79, current 36.49 — above the market average on PER.
- 5y-avg Average Price/FCF 36.36, current 44.54 — above the market average on Price/FCF.
Net: MSFT is fairly overvalued on an earnings basis — a price hard to justify on pure results. But as a dominant AI-infrastructure player, the market is pre-pricing the value GenAI will bring. The decision to hold MSFT thus rests on whether you believe (1) earnings-based SaaS / computing-infrastructure growth, or (2) the aggressive GenAI investment for future market capture.
The valuation check for $META and $AAPL, reporting later this week, will be updated subsequently.