April 2025 Market Recap and May Liquidity Outlook

1. SPX, Treasury Yields, and GOLD
After the Trump administration's April 2 reciprocal-tariff announcement, macro- and micro-level uncertainty surged. Funds left equities, the main risk-asset class, and Treasury yields moved differently from Q1 2025.
In theory, when equities fall long yields tend to fall too — recession fear lifts safe-asset demand, bond prices rise, yields fall. Recently this traditional correlation no longer held: equities fell yet long yields rose instead.
Before the announcement, as uncertainty widened the market gradually trimmed equity exposure and favored Treasuries and gold (a textbook move). But after it, a sudden dollar weakness (dollar outflow) — centered on damaged trust in US exceptionalism — brought substantial volatility. The market's read: applying reciprocal tariffs to the global supply chain means the end of the free-trade era, and dollar hegemony is, not to overstate it, underpinned by free trade — break that and the market naturally doubts dollar hegemony, so dollar capital that had flowed into equities and bonds flowed out. Yields rose sharply alongside the equity decline.
(1) The Basis-Trade Unwind, and Trump's Capitulation
The basis-trade-unwind risk then layered on. The basis trade seeks profit from the subtle price gap between cash and futures Treasuries (when cash is relatively low / futures high: buy cash + sell futures), typically with large leverage (up to 100x). As yields spiked, the cash–futures gap widened explosively and basis-strategy hedge-fund liquidations surged, worsening market liquidity in the process.
Unwind dynamics:
- Margin Call — volatility / yield spikes widen the spread, triggering additional margin. At 30–100x leverage, small spread changes scale margin demands exponentially.
- Short Cover (sell cash Treasuries & buy back futures) — mass selling of held Treasuries → bond prices down, yields up.
- Dealer saturation and repo-rate spike — rapid selling exceeds dealer inventory limits, causing Bid-Ask widening and a price-vacuum. (Price vacuum: dealers absorb selling to provide liquidity but face balance-sheet limits via SLR / VaR; with large selling they refuse more, withdraw bids or widen spreads, valid trading prices vanish, trading halts or sellers must dump far lower.)
- Secondary selling pressure — asset managers / mutual funds sell more on price crashes for outflow / collateral; foreign central banks sell long-end for FX defense / liquidity; Cross-Asset Deleveraging as Risk-Parity / CTA models sell bonds and equities together on VaR triggers.
- VaR (Value at Risk): the statistical max portfolio loss over a target horizon at a confidence level. (1-day VaR $1M at 99% → "99% chance the 1-day loss does not exceed $1M" = 1% chance of a loss over $1M.)
- VaR trigger: a risk mechanism dynamically adjusting portfolio exposure off VaR thresholds.
- Risk Parity: focuses on risk, not asset-class, diversification — balances per-asset-class risk, rebalancing allocation / leverage on volatility / correlation shifts.
- CTA (Commodity Trading Advisor): invests in derivatives, mostly systematic trend-following. Allocates more capital to outperforming strategies (raising VaR), cuts exposure in losses (lowering VaR); on volatility spikes (e.g. 2020 COVID), the VaR trigger forcibly cuts leverage.
The sharp yield rise raises not only future-issuance demand uncertainty but the US government's interest-cost burden. Trump eventually played the 90-day reciprocal-tariff-pause card and capitulated, revealing to all participants that the weak point is Treasury yields.
(2) The Fire Barely Contained, but Powell's Stance
The 90-day pause did not eliminate tariff uncertainty at all. The 10% universal tariff applied to all exporters from April 9, and over 90 days exporters must negotiate a reasonable outcome with the administration. As China-negotiation expectations rose, on April 16 Powell emphasized the stagflationary nature of tariffs and, on the recent slump, said "there will be no Fed intervention," dashing market hopes.
2. Short-Term Liquidity Risk Resolved
Whether or not the US economy enters recession from tariffs this year, judging that the possible uncertainties / risks were already all disclosed, the market moved to pre-price. While the market focused on geopolitics and recession odds, the April tax season passed quietly, refilling the TGA.
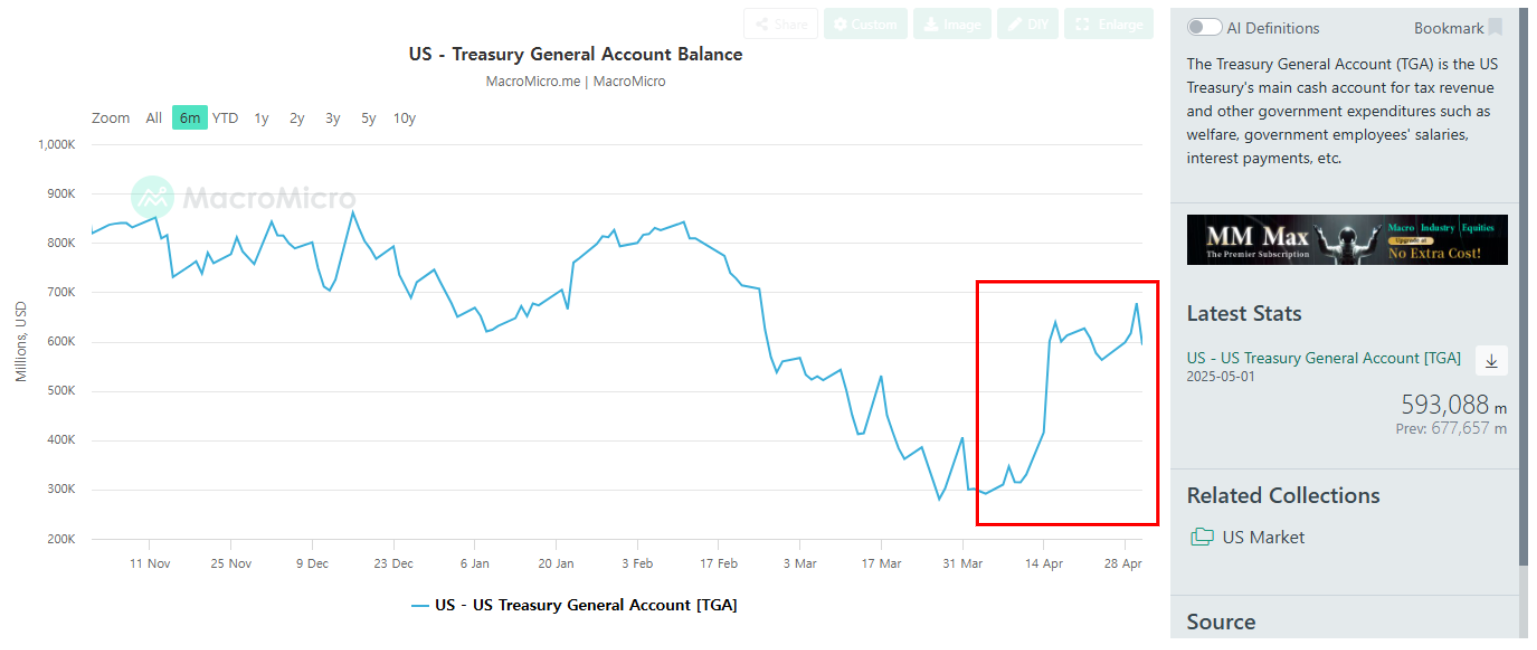
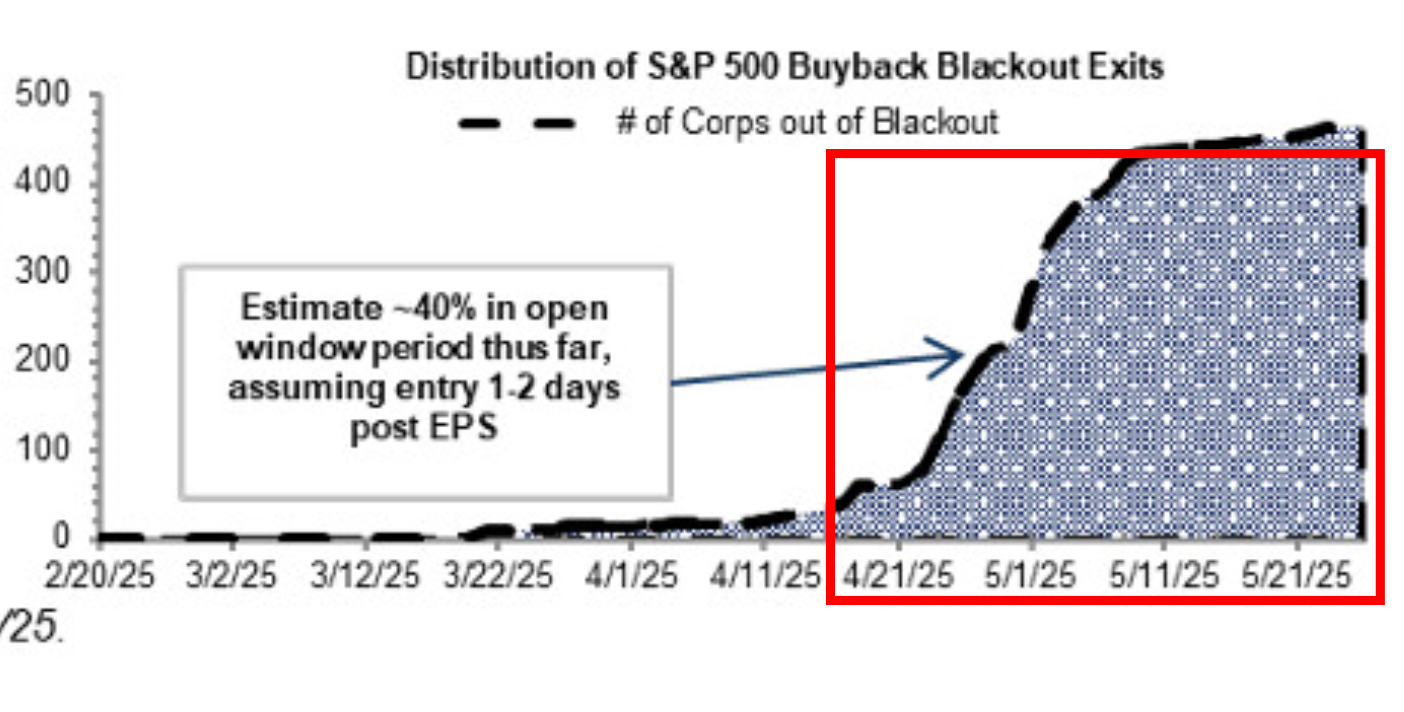
As noted in the March liquidity-outlook note, April is when private liquidity is absorbed into the government via 2024 income-tax payments. The end of payments after April 15 means short-term liquidity risk is resolved. April includes a corporate-buyback blackout; from month-end companies can resume buybacks.
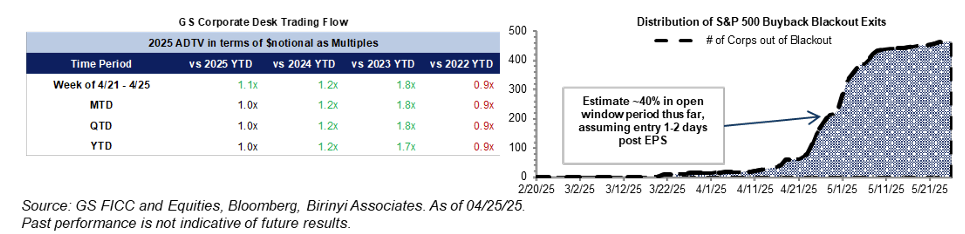
Per Goldman Sachs's buyback desk, as of April 25 ~40% of companies entered the "open window" to execute buybacks freely, expanding to 65% by month-end, with the window running to June 13. In sum: (i) April 15 income-tax payment ends, private liquidity absorbed into the TGA; (ii) buyback window opens from late April — the most critical liquidity risk is resolved and short-term tailwinds are added.
3. Earnings Season
Major US tech earnings began April 22. Focusing on the CapEx commentary of AI Infrastructure & Application names:
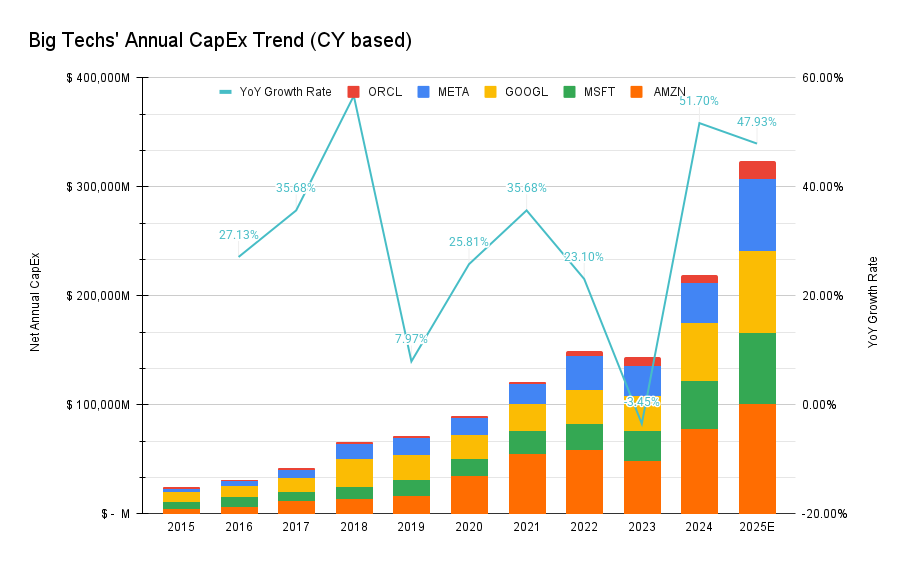
$AMZN·$MSFT·$GOOGL·$META·$ORCL all cited server-capacity shortage, the need to expand both AI and general-server investment, AI compute shortfall, and intent to accelerate data-center capacity. With AI demand rising faster than expected and possible capacity constraints from June 2025, H2 infrastructure investment will keep expanding — i.e. they intend to raise CapEx. This resolves two uncertainties the market had held:
- AI-compute-demand bubble skepticism led by the DeepSeek episode (Jevons paradox).
- US H2-2025 recession odds (at least short-term — expanding CapEx when one must focus on margin in a near-recession is contradictory).
4. Employment Data

The May 2 jobs print beat expectations, contributing substantially (short-term) to resolving US-recession uncertainty. The April 2025 report shows labor momentum stable but slowing. Nonfarm payrolls beat estimates but grew less than March; unemployment held at 4.2%; wage growth eased; prior months were revised down. Net: the market is no longer overheating, reducing the Fed's case for more tightening, but amid lingering tariff uncertainty the urgency to rush cuts also fell.
- Better than feared, calmer than overheated — above-estimate gains showed jobs still being created despite the weak Q1 GDP and tariff turmoil. But downward prior revisions and the slowing 3-month average (+155k) confirm gradual momentum weakening.
- Easing wage pressure — annual wage growth of 3.8% is the lowest since mid-2024, reducing wage-price-spiral risk.
- Tariff uncertainty — since the survey window closed right after the April 2 announcement, employment shocks in manufacturing / transport / retail supply chains may only fully show by end-Q2.
The April data extends a soft-landing scenario — growth slowing at a moderate pace, avoiding recession. The key is how much added tariffs shock supply chains and sentiment.
5. May Liquidity Outlook
Fundamentals are fragile / unstable, but at least short-term, technical factors hold the lead.
(1) TGA outflow
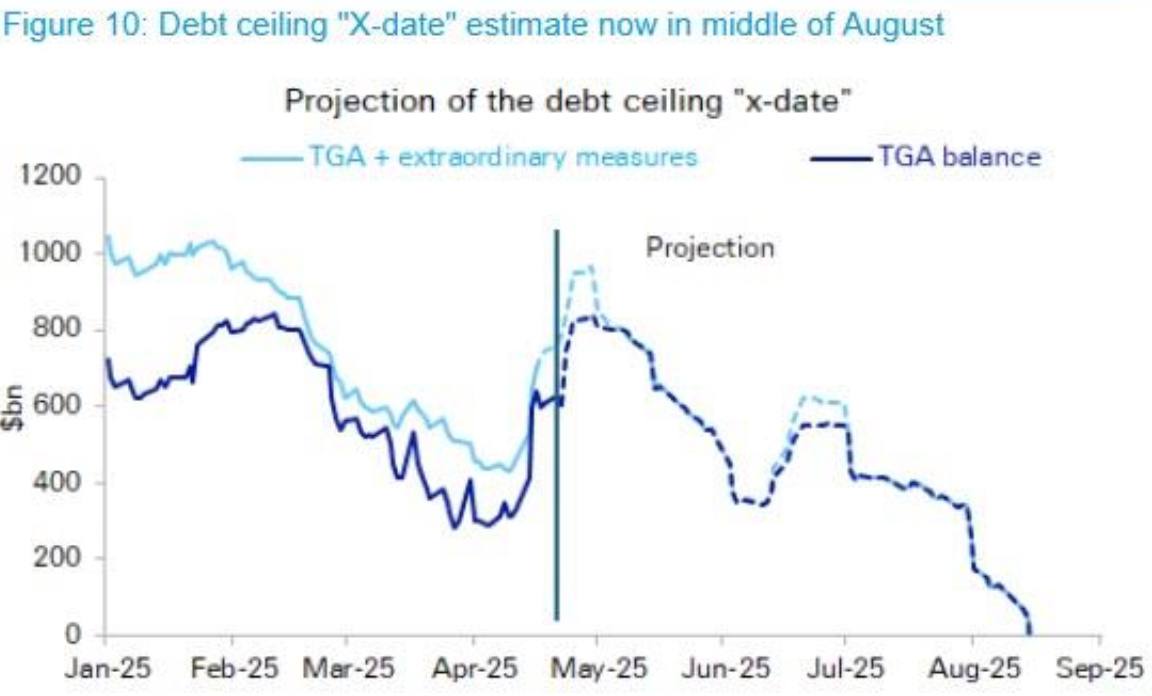
Deutsche Bank pushed its TGA X-date estimate from late July to mid-August. The key: until the debt-ceiling deal, the TGA repeatedly fills and drains, and the post-April-tax-season-filled balance drains over May–June. TGA drawdown means rising system liquidity — a short-term positive (the problem is refilling the TGA after the deal — see the March liquidity note).
(2) Buybacks
US corporate buybacks begin from late April — also a liquidity-supply tailwind.
(3) Volatility-Control funds and CTA position shift
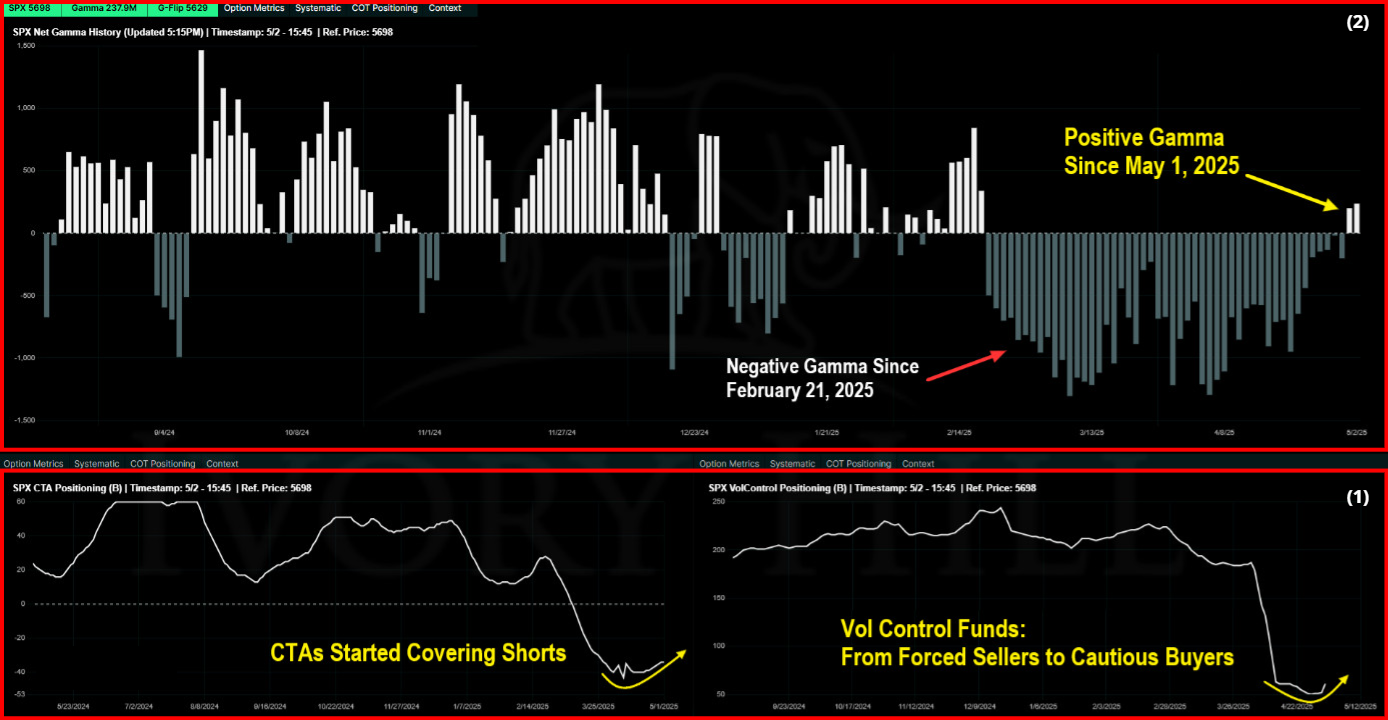
Volatility Control is a systematic strategy adjusting asset weights to hold portfolio volatility at a level (realized vol 〉 target → cut equity weight; vol ↓ → raise it). Chart bottom (1): Vol-Control funds and CTAs began a cautious position shift (sell→buy) from late April. With sharply lower VIX, Vol-Control funds raise leverage to expand volatility, and CTAs began short-covering. Chart top (2): the time-series of S&P 500 total Gamma — Gamma is the change in Delta's change (Delta's acceleration, sensitivity to underlying-price change). Gamma, negative from mid-February to late April, flipped positive in early May — read as traders shifting from option shorts to longs. A signal of key participants' sentiment / position change and added liquidity inflow. In sum, these three factors should technically contribute to liquidity inflow over roughly one to one-and-a-half months.
(4) But, the economic-data read
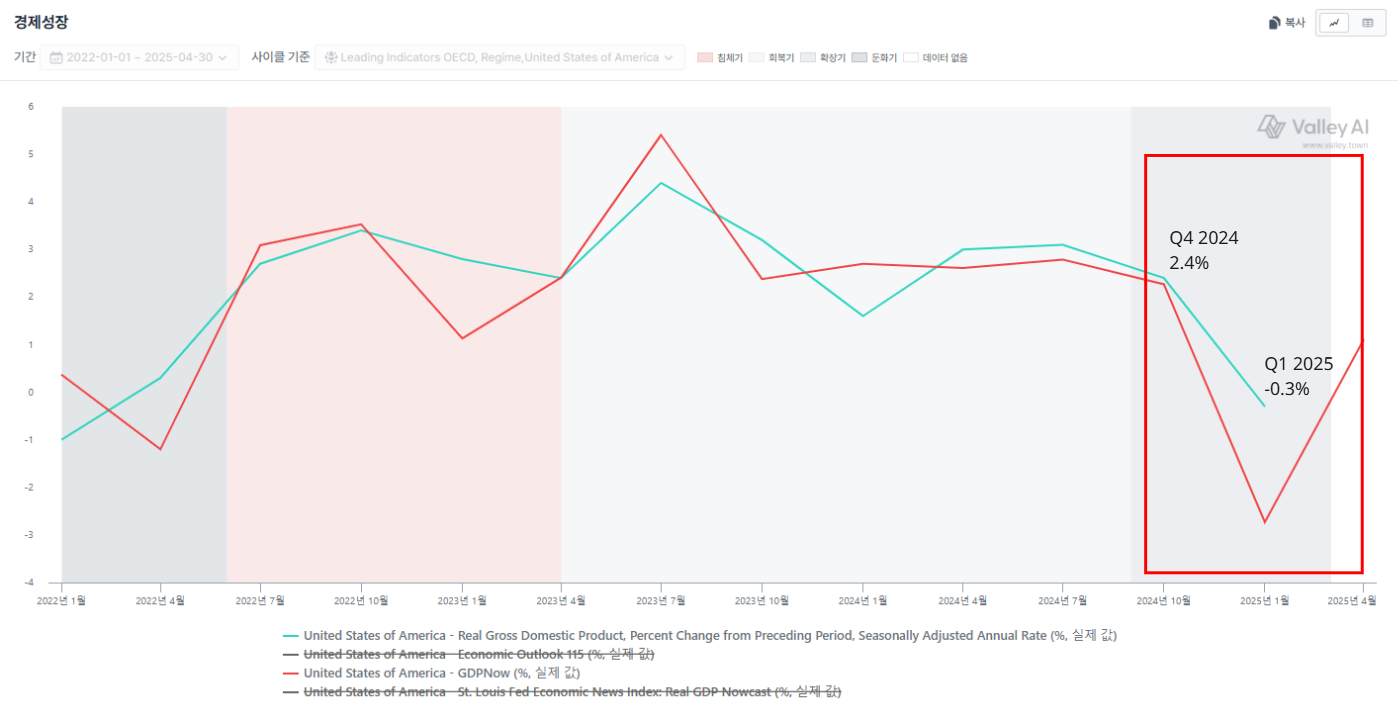
The hard data so far describes the pre-tariff economy.
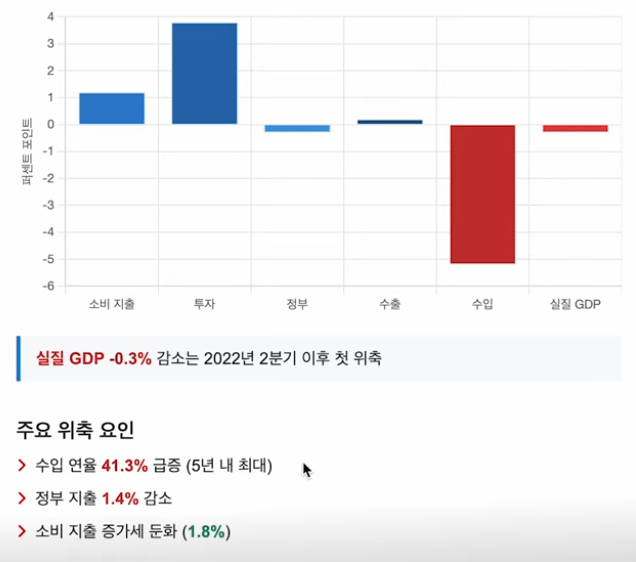
Q1 2025 real GDP was −0.3% YoY; the contributor was imports +41.3% YoY — proving pre-tariff large-scale stockpiling (front-running) by consumers and firms.
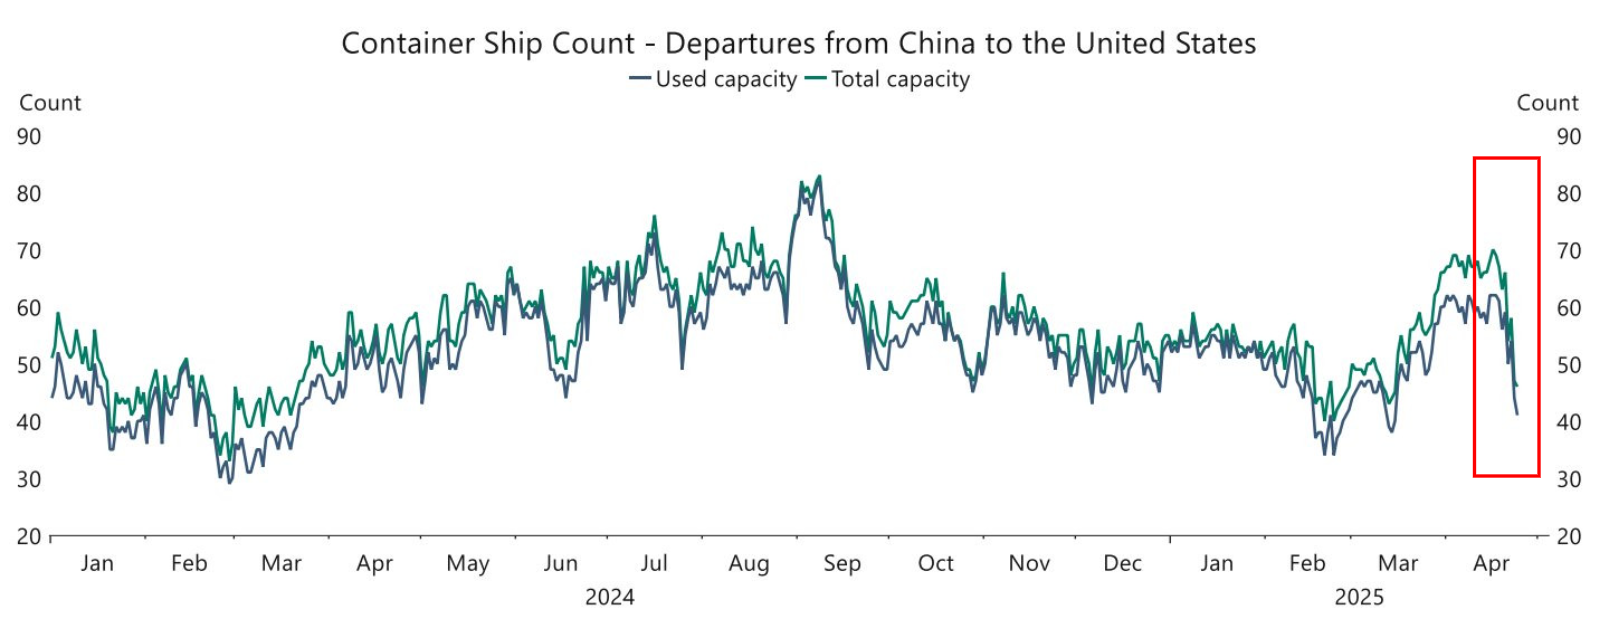
The number of China→US container ships plunged.
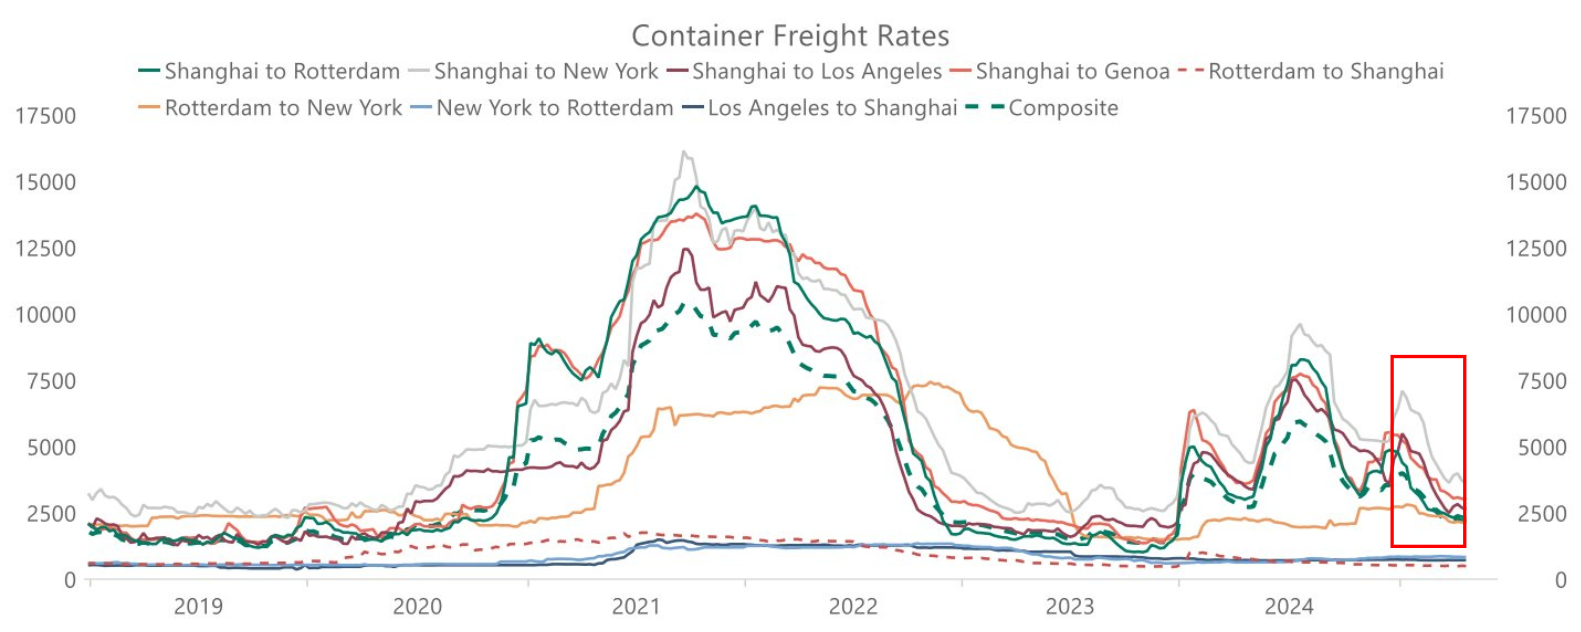
Container freight rates fell accordingly.
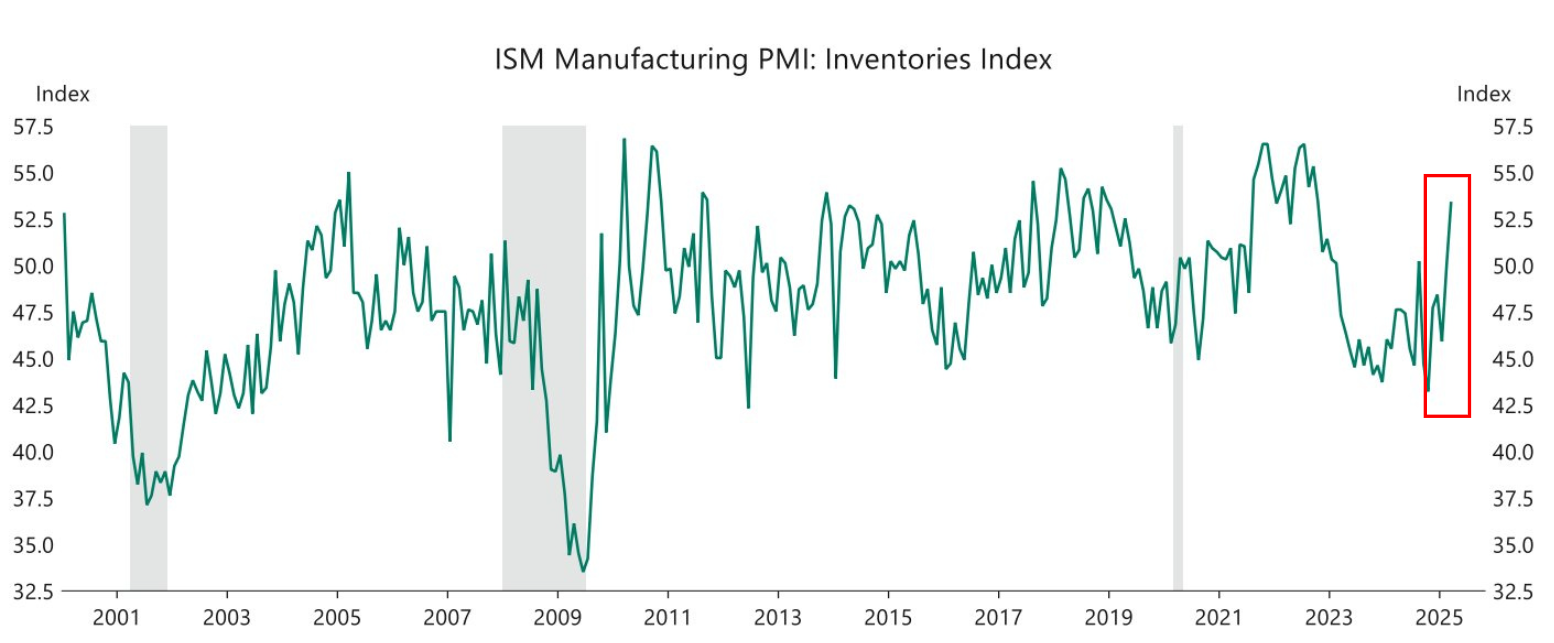
Firms raised imports to dodge the tariff impact materializing from end-Q2, and inventories surged — tariff-avoidance stockpiling.
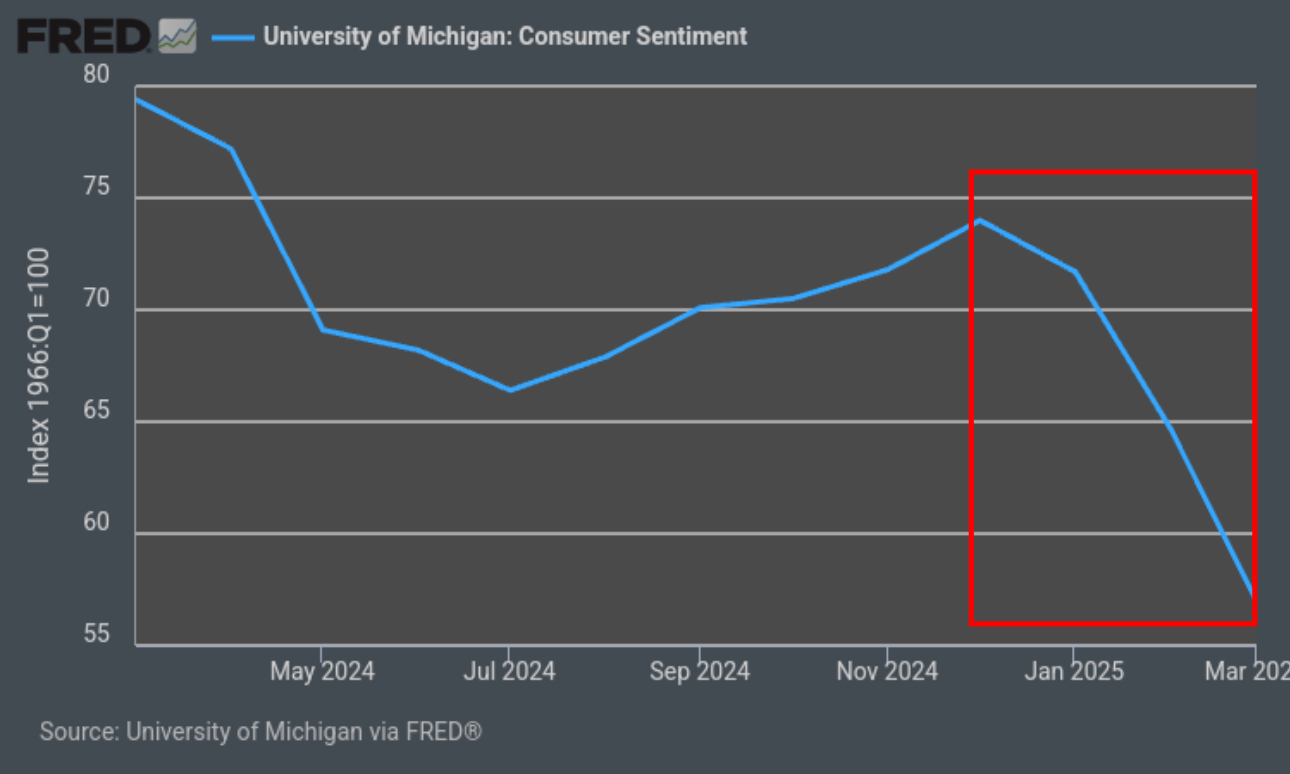
Soft data is strongly negative — the UMich consumer-sentiment index has kept declining since Trump's win.
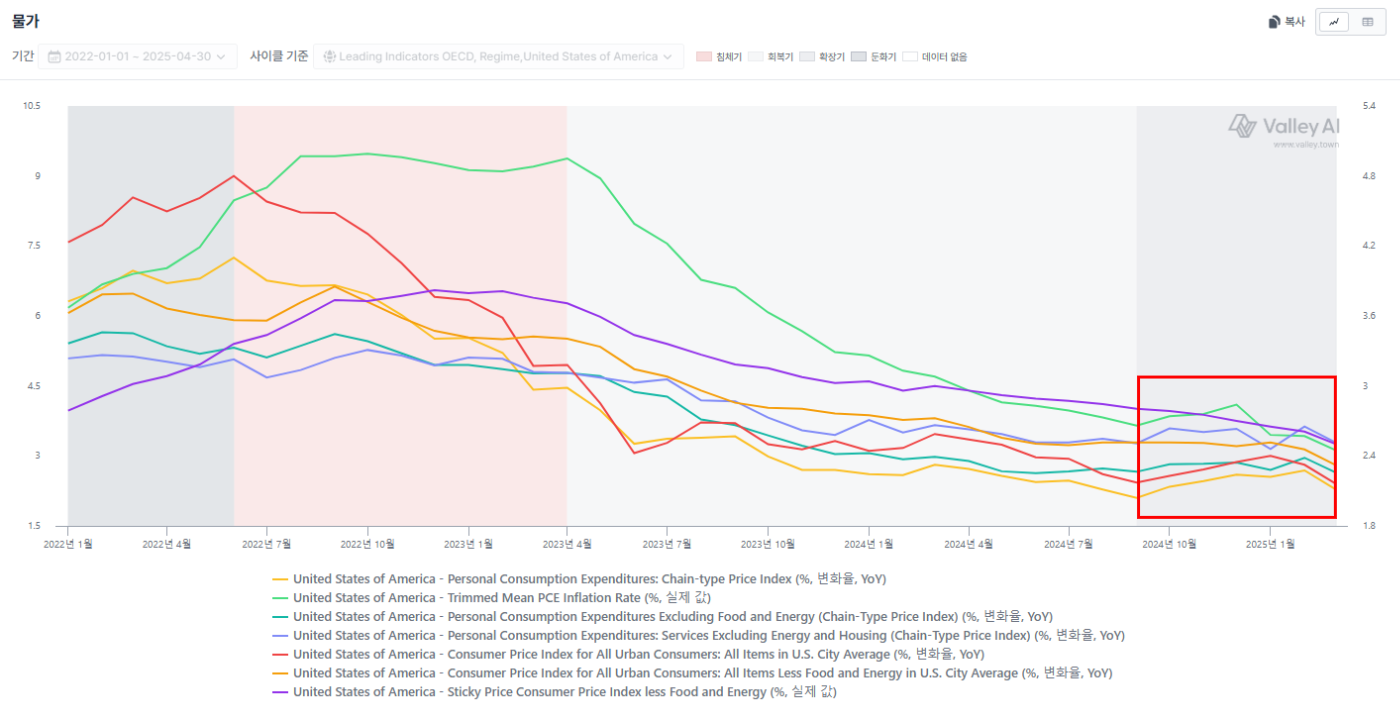
Fortunately inflation is gradually being tamed — the Fed's need for more tightening disappears, but it is not a situation to ease either.
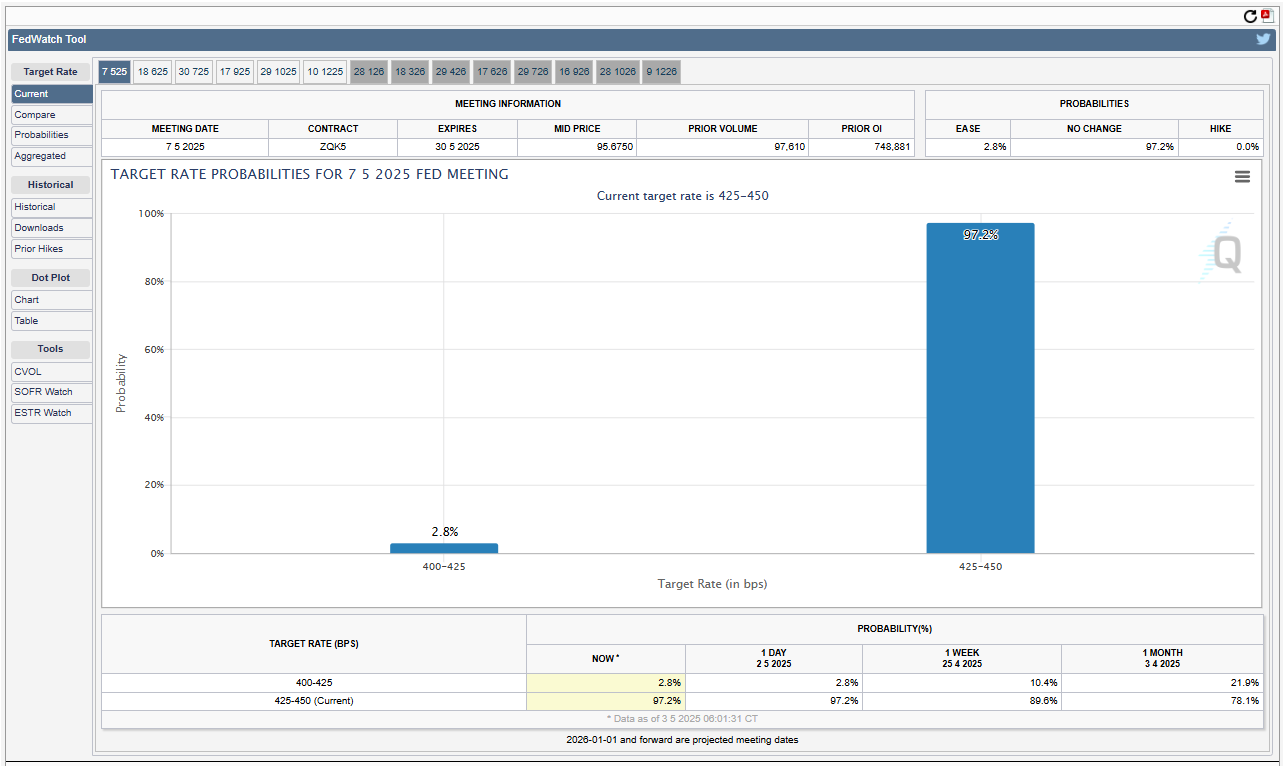
The market ideally pencils a May 7 FOMC cut, while FedWatch expects a hold — Powell will again hold a 'wait and see' stance.
In sum, hard data describes the pre-tariff period. The market took comfort in April jobs, but since the survey window closed right after the April 2 announcement, the manufacturing / transport / retail supply-chain employment shock risks only fully showing by end-Q2. Given the China→US container plunge and stockpiling, the tariff shock shows from here — likely quantified in hard data from end-Q2.
Overall, the current technical setup is very positive short-term — (1) the TGA drains until the debt-ceiling deal, (2) corporate buybacks ramp, (3) systematic-trading funds began the sell→buy turn. The reciprocal-tariff uncertainty has peaked and is declining, but the fact that tariffs will be imposed is unchanged — economic uncertainty remains. A tape optimized for short-term-volatility trades, but medium-to-long term one should enter cautiously, spaced over time.
6. Personal View
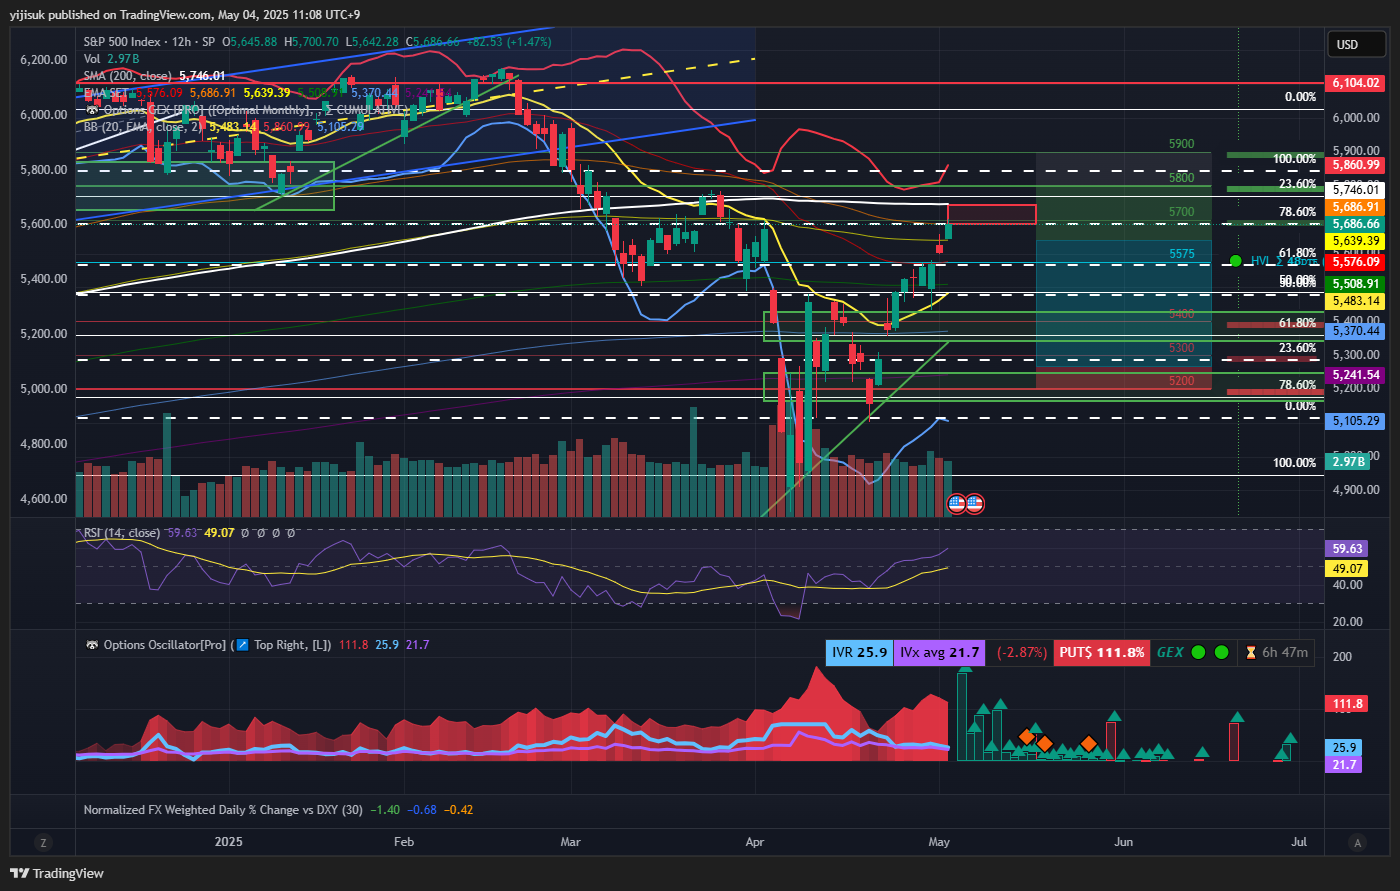
The S&P 500 rose nine sessions running. It is near the underside of the 200MA; next week's key is whether it breaks that line. (Per options data) the market is broadly positioned for short-term resistance at the 200MA underside. (My own take) given the short-term-positive liquidity outlook, I see it resisting briefly at the 200MA underside then breaking through. I set a base target of 5,750–5,800 and a bullish target of 5,800–5,900, and plan to trade mainly short swing.